Unlock a world of possibilities! Login now and discover the exclusive benefits awaiting you.
Announcements
Introducing Qlik Answers: A plug-and-play, Generative AI powered RAG solution.
READ ALL ABOUT IT!
- Qlik Community
- :
- All Forums
- :
- QlikView App Dev
- :
- 1 Dim and 5 Exp
Options
- Subscribe to RSS Feed
- Mark Topic as New
- Mark Topic as Read
- Float this Topic for Current User
- Bookmark
- Subscribe
- Mute
- Printer Friendly Page
Turn on suggestions
Auto-suggest helps you quickly narrow down your search results by suggesting possible matches as you type.
Showing results for
Not applicable
2013-02-16
05:00 AM
- Mark as New
- Bookmark
- Subscribe
- Mute
- Subscribe to RSS Feed
- Permalink
- Report Inappropriate Content
1 Dim and 5 Exp
Hi Guys
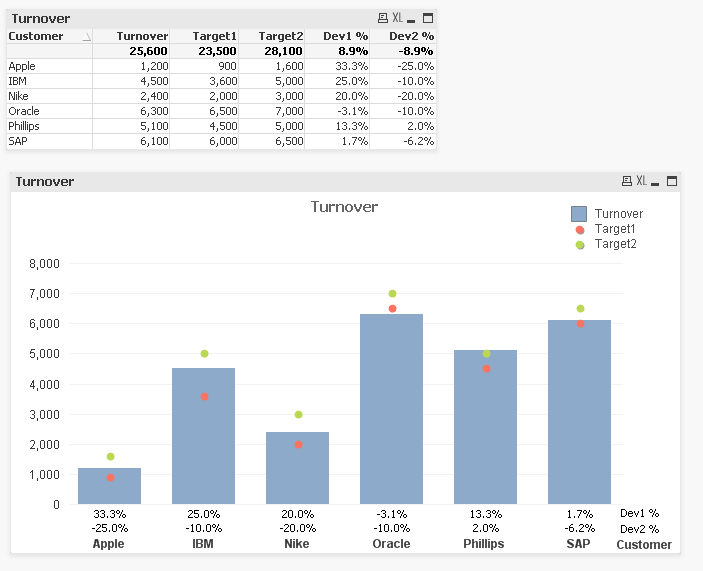
I have a Dimension : Customer Name and
5 Exp : Turnover , Target1 , Target2 , Deviation1 in percentage and Deviation2 in percentage .
can anyone tell me which is the best chart to show .
248 Views
1 Reply
2013-02-16
06:06 AM
- Mark as New
- Bookmark
- Subscribe
- Mute
- Subscribe to RSS Feed
- Permalink
- Report Inappropriate Content
I think I'd use both a straight chart and a combi chart.

See attached example.
talk is cheap, supply exceeds demand