Unlock a world of possibilities! Login now and discover the exclusive benefits awaiting you.
- Qlik Community
- :
- All Forums
- :
- QlikView App Dev
- :
- Re: 100% stacked column chart in Qlikview?
- Subscribe to RSS Feed
- Mark Topic as New
- Mark Topic as Read
- Float this Topic for Current User
- Bookmark
- Subscribe
- Mute
- Printer Friendly Page
- Mark as New
- Bookmark
- Subscribe
- Mute
- Subscribe to RSS Feed
- Permalink
- Report Inappropriate Content
100% stacked column chart in Qlikview?
I need to create a bar chart in Qlikview that displays information of 2 dimensions (period and segment) and 1 expression (value in%), that total 100% in the bars.
Sum (Value) / Sum (Total Value).
When I use the "Total" or "All", the chart considers the value of all periods, when in fact I should only consider the total per period. I have already tried to use the Aggr expression, but it gives miscalculation.
Aggr (Sum (Value) / Sum (Total Value), Period).
I believe that Set Analysis does not apply to this calculation, since it will always consider the total value (of all periods).
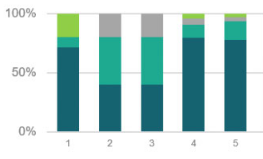
In another environment, this graph is native and is called "100% Stacked Column Chart", as shown below.

Is it possible to reproduce this graph in Qlikview?
Tks!!!
Accepted Solutions
- Mark as New
- Bookmark
- Subscribe
- Mute
- Subscribe to RSS Feed
- Permalink
- Report Inappropriate Content
Karen,
I believe you need to remove your "{}" curly brackets.
Try this:
Count( CPF_CNPJ ) / Count( TOTAL <Periodo_Movimentacao> CPF_CNPJ )
Good luck
Oscar
- Mark as New
- Bookmark
- Subscribe
- Mute
- Subscribe to RSS Feed
- Permalink
- Report Inappropriate Content
Hi Karen,
Try
Sum (Value) / Sum (Total <Period> Value)
Good luck
Andrew
- Mark as New
- Bookmark
- Subscribe
- Mute
- Subscribe to RSS Feed
- Permalink
- Report Inappropriate Content
You can try an expression like the following:
Sum (Value) / Sum (Total <Period> Value)
Change your chart properties under style select Stacked:
Your result should look something like this:
Good Luck
Oscar
- Mark as New
- Bookmark
- Subscribe
- Mute
- Subscribe to RSS Feed
- Permalink
- Report Inappropriate Content
Oscar,
Thank you for your answer.
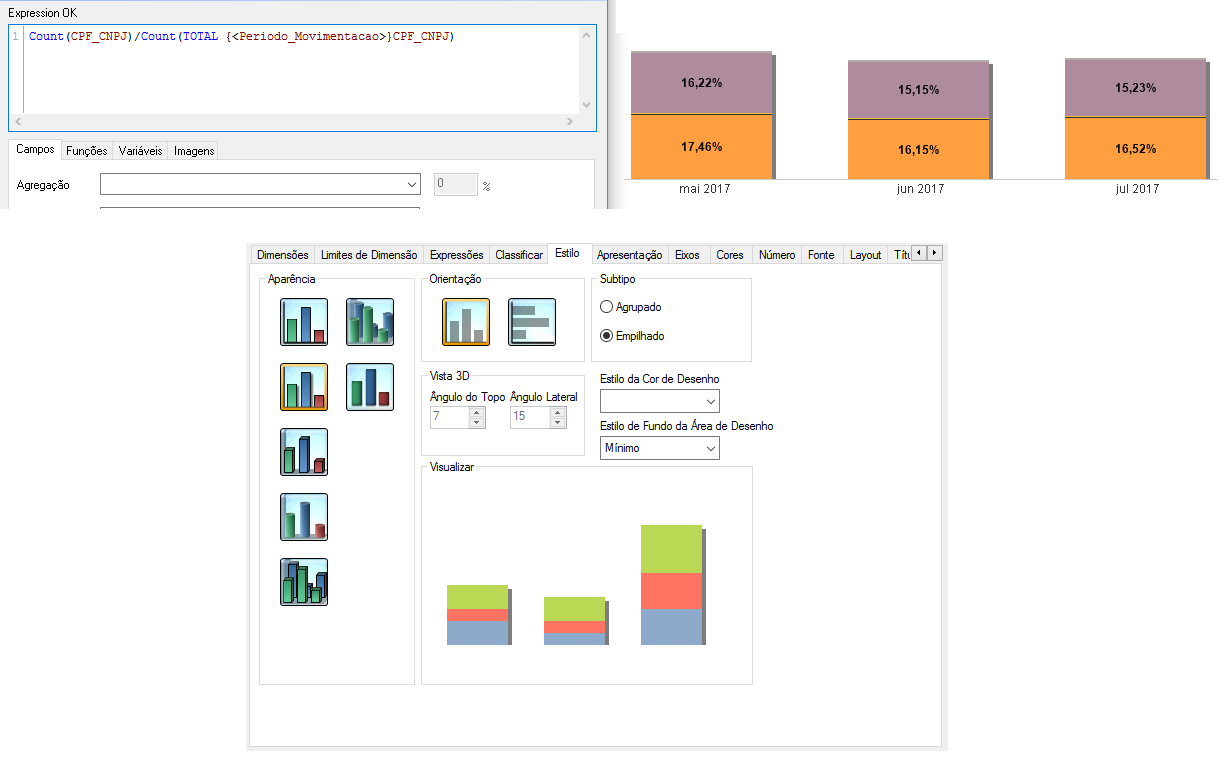
I tried but doesn't work like your example. Bellow:

- Mark as New
- Bookmark
- Subscribe
- Mute
- Subscribe to RSS Feed
- Permalink
- Report Inappropriate Content
Karen,
I believe you need to remove your "{}" curly brackets.
Try this:
Count( CPF_CNPJ ) / Count( TOTAL <Periodo_Movimentacao> CPF_CNPJ )
Good luck
Oscar
- Mark as New
- Bookmark
- Subscribe
- Mute
- Subscribe to RSS Feed
- Permalink
- Report Inappropriate Content
Thank you so much Oscar! It worked ![]()
- Mark as New
- Bookmark
- Subscribe
- Mute
- Subscribe to RSS Feed
- Permalink
- Report Inappropriate Content
Hi Oscar,
Again I need to make this rule, but now also using Set Analysis, and following the same rule, doesn't return 100%
For Example:
Count({$<Code={"10"}>}Id)/Count(Total <Month,Day> {$<Code={"10"}>}Id)

- Mark as New
- Bookmark
- Subscribe
- Mute
- Subscribe to RSS Feed
- Permalink
- Report Inappropriate Content
Karen,
Could you possibly provide some sample data with an explanation of what you are trying to do?
In your image what do the values in the legend associate to?
For the expression that you have it looks like you are simply trying to look at the Code=10 by date. Do you have an actual date field in your data model? Rather than using the Month and Day. Or possibly change your expression to use whatever value you have in your legend rather than the date.
Good luck
Oscar