Unlock a world of possibilities! Login now and discover the exclusive benefits awaiting you.
- Qlik Community
- :
- All Forums
- :
- QlikView App Dev
- :
- Re: 12 rolling months
- Subscribe to RSS Feed
- Mark Topic as New
- Mark Topic as Read
- Float this Topic for Current User
- Bookmark
- Subscribe
- Mute
- Printer Friendly Page
- Mark as New
- Bookmark
- Subscribe
- Mute
- Subscribe to RSS Feed
- Permalink
- Report Inappropriate Content
12 rolling months
Hello community,
I'm facing an issue by trying to make a 12 rolling months in a line chart.
This chart has a calculation condition: GetSelectedCount(YEAR)=1 and GetSelectedCount(MONTH)=1
Here is my data model to make this chart :
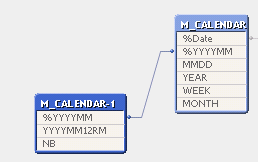
NB is field which counts the number of months different of the period YYYYMM12RM. For example :
%YYYYMM YYYYMM12RM NB
201404 201404 1
201404 201403 2
201404 201402 3
201404 201401 4
201404 201312 5
201404 201311 6
201404 201310 7
201404 201309 8
201404 201308 9
201404 201307 10
201404 201306 11
201404 201305 12
I use in the dimensions the field %YYYYMM.
The expression used is: Sum({<YEAR=, MONTH=, %YYYYMM={">=$(vPeriodMin)<=$(vPeriodMax)"}>} Sales)
where vPeriodMin=Max({<NB={'12'}>} YYYYMM12RM) and vPeriodMax=Max({<NB={'1'}>} YYYYMM12RM).
It seems that my expression doesn't take into account my Set Analysis.
Does anyone have an idea please ?
Thanks in advance,
Regards,
Quentin
Accepted Solutions
- Mark as New
- Bookmark
- Subscribe
- Mute
- Subscribe to RSS Feed
- Permalink
- Report Inappropriate Content
Hello,
I finally found a solution for my 12 rolling months line chart.
Here is my dimension:
=if(right(YYYYMM12RM, 2)='01',
if(YYYYMM12RM+11>=$(vPeriodMin) and YYYYMM12RM+11<=$(vPeriodMax),
YYYYMM12RM+11
),
if(YYYYMM12RM+99>=$(vPeriodMin) and YYYYMM12RM+99<=$(vPeriodMax),
YYYYMM12RM+99
)
)
Here is my expression:
Above(Sum({<YEAR=, MONTH=, %Date=, %YYYYMM={'>=$(vPeriodMin))<=$(vPeriodMax)'}>} [Sales Quantity MTH]), 0, 11)
Thanks to mphekin12 and Gysbert Wassenaar for their help.
Regards,
Quentin
- Mark as New
- Bookmark
- Subscribe
- Mute
- Subscribe to RSS Feed
- Permalink
- Report Inappropriate Content
Quentin,
Please read this post by Gysbert Wassenaar:
Calculating rolling n-period totals, averages or other aggregations
- Mark as New
- Bookmark
- Subscribe
- Mute
- Subscribe to RSS Feed
- Permalink
- Report Inappropriate Content
Thanks for the fast answer mphekin12.
I tried to understand Gysbert's example.
In his example, the table AsOfMonth looks like my table Calendar-1. If I understood well, I just needed to change the dimension in my chart as it is showed in Gybert's example but the sum are calculated only for some date.
Could you please help me to understand ?
Thanks in advance,
Regards,
Quentin
- Mark as New
- Bookmark
- Subscribe
- Mute
- Subscribe to RSS Feed
- Permalink
- Report Inappropriate Content
Any ideas ?
Thanks in advance,
Quentin
- Mark as New
- Bookmark
- Subscribe
- Mute
- Subscribe to RSS Feed
- Permalink
- Report Inappropriate Content
Hello,
I finally found a solution for my 12 rolling months line chart.
Here is my dimension:
=if(right(YYYYMM12RM, 2)='01',
if(YYYYMM12RM+11>=$(vPeriodMin) and YYYYMM12RM+11<=$(vPeriodMax),
YYYYMM12RM+11
),
if(YYYYMM12RM+99>=$(vPeriodMin) and YYYYMM12RM+99<=$(vPeriodMax),
YYYYMM12RM+99
)
)
Here is my expression:
Above(Sum({<YEAR=, MONTH=, %Date=, %YYYYMM={'>=$(vPeriodMin))<=$(vPeriodMax)'}>} [Sales Quantity MTH]), 0, 11)
Thanks to mphekin12 and Gysbert Wassenaar for their help.
Regards,
Quentin