Unlock a world of possibilities! Login now and discover the exclusive benefits awaiting you.
- Qlik Community
- :
- All Forums
- :
- QlikView App Dev
- :
- 2 dimensions and 2 expressions in chart
- Subscribe to RSS Feed
- Mark Topic as New
- Mark Topic as Read
- Float this Topic for Current User
- Bookmark
- Subscribe
- Mute
- Printer Friendly Page
- Mark as New
- Bookmark
- Subscribe
- Mute
- Subscribe to RSS Feed
- Permalink
- Report Inappropriate Content
2 dimensions and 2 expressions in chart
Hi all,
I have a year-over-year comparison bar chart, with 2 dimensions: 1) Fiscal Year, 2) Fiscal Month
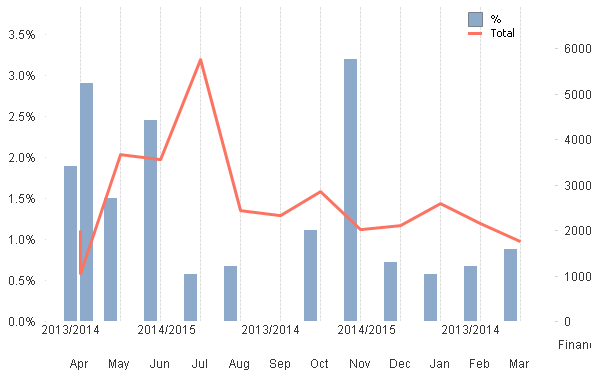
With 1 expression, it works fine, but if I add another expression, the chart becomes messy. How can I get 2 expressions on this chart?
The chart currently looks like this:

But when I add another expression, it looks like this:

Can I add another expression with bars but keep the Year legend at the side, and not have the Financial years at the bottom axis?
- Tags:
- new_to_qlikview
- Mark as New
- Bookmark
- Subscribe
- Mute
- Subscribe to RSS Feed
- Permalink
- Report Inappropriate Content
Hi.
As a common workaround you can create another chart for total line, make it transparent and turn off all text labels, place it on top of the first chart.
But since your chart is displayed almost correct, you can create another small chart with no data to show the legend only. And use expression for backgroundcolor to colorize the years properly.
- Mark as New
- Bookmark
- Subscribe
- Mute
- Subscribe to RSS Feed
- Permalink
- Report Inappropriate Content
For this you need to take the year in dimension
- Mark as New
- Bookmark
- Subscribe
- Mute
- Subscribe to RSS Feed
- Permalink
- Report Inappropriate Content
Use Drill down for year and month in the dimensions it will help you out, so that the chart will come perfect.... ![]()