Unlock a world of possibilities! Login now and discover the exclusive benefits awaiting you.
- Qlik Community
- :
- All Forums
- :
- QlikView App Dev
- :
- Re: 2d dimension disappeared QV11 --> QV12
- Subscribe to RSS Feed
- Mark Topic as New
- Mark Topic as Read
- Float this Topic for Current User
- Bookmark
- Subscribe
- Mute
- Printer Friendly Page
- Mark as New
- Bookmark
- Subscribe
- Mute
- Subscribe to RSS Feed
- Permalink
- Report Inappropriate Content
2d dimension disappeared QV11 --> QV12
Hello Qlik community,
I am back from my holidays and I've seen Qlikview 12 installed on our machines.
I opened a report I created (that is also published on an AccessPoint) and I've noticed some changes that I cannot correct
My graph initially with QV11 :

became in QV12
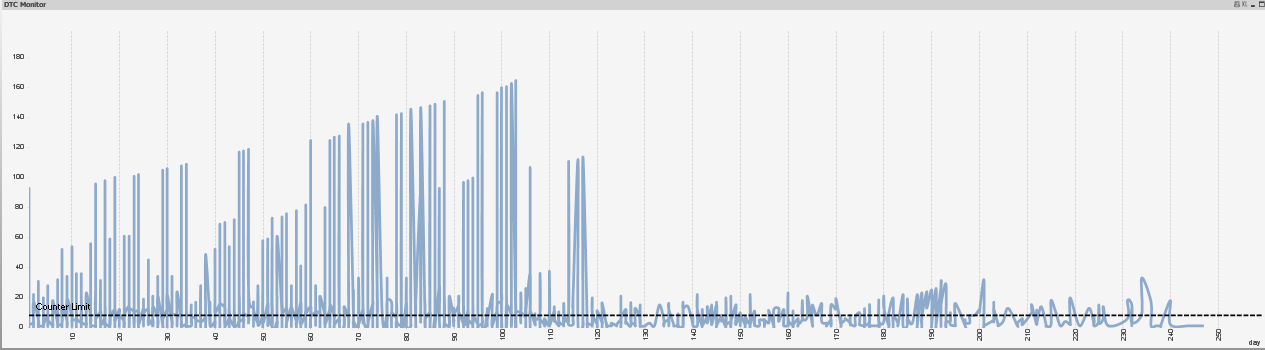
It seems that my second dimension "chassis" has gone (you can see on the right, there is no legend for this variable, but it should be)

This is really strange because both reports are the same (same formulas same data source).
I've tried several options but still I have this issue. Is it specific to QV12 ? Is there a way to go back to the preivous display ?
Any help ?
Thank you in advance for your suggestions.
- Mark as New
- Bookmark
- Subscribe
- Mute
- Subscribe to RSS Feed
- Permalink
- Report Inappropriate Content
May be aggregation issue, Would you share expressions in notepad for that. I know you have many expression. Will try with one expression if it works then may be will look others
- Mark as New
- Bookmark
- Subscribe
- Mute
- Subscribe to RSS Feed
- Permalink
- Report Inappropriate Content
Here is the only formula I use as expression
=sum(Aggr(max(counter),date,chassis,desc))
- Mark as New
- Bookmark
- Subscribe
- Mute
- Subscribe to RSS Feed
- Permalink
- Report Inappropriate Content
Is desc a dimension?
Try renaming it, could be that QV12 recognizes this as a structured parameter...
- Mark as New
- Bookmark
- Subscribe
- Mute
- Subscribe to RSS Feed
- Permalink
- Report Inappropriate Content
desc is a string variable and not used as a dimension.
The only dimension I use in this graph are
day
chassis
I have renamed it "description" and the issue remains 
- Mark as New
- Bookmark
- Subscribe
- Mute
- Subscribe to RSS Feed
- Permalink
- Report Inappropriate Content
Why do you use a variable as dimension within aggr()?!?!?
How is desc defined?
- Mark as New
- Bookmark
- Subscribe
- Mute
- Subscribe to RSS Feed
- Permalink
- Report Inappropriate Content
Because I want to display
per day and per chassis
the maximum value of "counter" for all selected desc
if only 1 desc (desc stands for description) is selected then it is easy but if we select 2 desc I need the sum of counter per day and per chassis for these 2 desc
That is why I put desc in aggr function but maybe I was wrong doing it.
Thank you for your help
- Mark as New
- Bookmark
- Subscribe
- Mute
- Subscribe to RSS Feed
- Permalink
- Report Inappropriate Content
Hm, I don't have your data, perhaps
=sum(Aggr(max(counter),date,chassis))
works.
- Mark as New
- Bookmark
- Subscribe
- Mute
- Subscribe to RSS Feed
- Permalink
- Report Inappropriate Content
I've noticed something.
It has to do with the fact that my axis (day) is continuous - if I remove it it works BUT my axis is not continuous anymore and I want to keep it continuous.
Any idea ?