Unlock a world of possibilities! Login now and discover the exclusive benefits awaiting you.
- Qlik Community
- :
- All Forums
- :
- QlikView App Dev
- :
- Re: [ASK] - Top 5 YTD Value including Total value ...
- Subscribe to RSS Feed
- Mark Topic as New
- Mark Topic as Read
- Float this Topic for Current User
- Bookmark
- Subscribe
- Mute
- Printer Friendly Page
- Mark as New
- Bookmark
- Subscribe
- Mute
- Subscribe to RSS Feed
- Permalink
- Report Inappropriate Content
[ASK] - Top 5 YTD Value including Total value for Top 5 and Overall Total
Hi Qlik Masters,
I'm back with another question. It seems that each day there are more and more interesting cases during my Qlikview Development.
Without further ado, I present you the case.
Background:
The users expect to see a report that looks like this one.
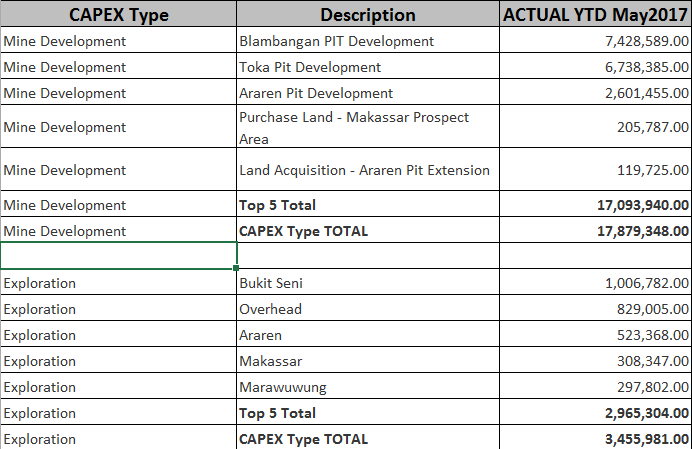
The rules for this report is that every CAPEX Type must have:
1. Top 5 Value - (Top 5 value and sort is based on the YTD value of selected Month, in this case is YTD May 2017)
2. Top 5 Total - (Total of presented Top 5 Value)
3. CAPEX Type Total - (Total YTD May 2017 for every CAPEX Type)
I don't know if this can be done in Qlikview or not. For now the only way that I can think of is to create each object for each CAPEXType, but it contains hard coding and won't be flexible if there are additional CAPEX Type in the future.
Attached with this discussion is the qvw and source file with dummy data.
Kindly take a look and please help me to solve this.
Your ideas are very much appreciated.
Cheers,
Adam Ginza
- « Previous Replies
-
- 1
- 2
- Next Replies »
- Mark as New
- Bookmark
- Subscribe
- Mute
- Subscribe to RSS Feed
- Permalink
- Report Inappropriate Content
Hi Sunny,
The confusing part for me is when you put the DIV(INDEX(CONCAT())).
I don't really understand how those three functions work together in the solution. Can you explain a little bit?
Cheers,
Adam Ginza
- Mark as New
- Bookmark
- Subscribe
- Mute
- Subscribe to RSS Feed
- Permalink
- Report Inappropriate Content
That is a way I used to calculate the rank. For more details on this, I have created a post on community. Check this out
- Mark as New
- Bookmark
- Subscribe
- Mute
- Subscribe to RSS Feed
- Permalink
- Report Inappropriate Content
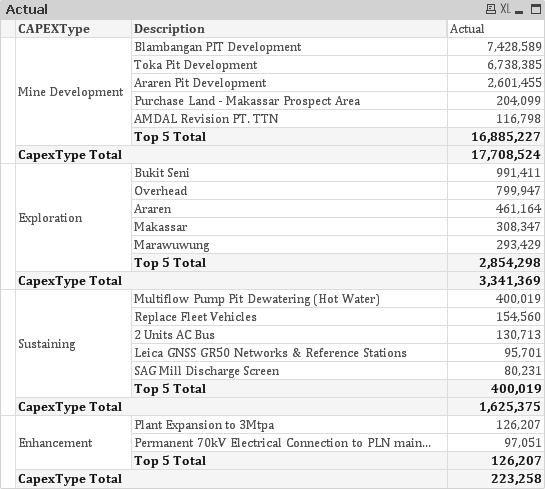
Another way of doing it through the chart presentation is by unchecking the always Pivot option and taking 2 dimension
Dimension : CapexType , CapexType, Description
Expression :
pick(Dimensionality() ,
(SUM({<Year = {"$(=MAX(Year))"},Month,Date = {"<=$(=DATE(MAX(Date)))"}>} total<CAPEXType> Actual)) ,
sum( aggr( SUM({<Year = {"$(=MAX(Year))"},Month,Date = {"<=$(=DATE(MAX(Date)))"}>} Actual)
*PurgeChar((rank(SUM({<Year = {"$(=MAX(Year))"},Month,Date = {"<=$(=DATE(MAX(Date)))"}>} Actual))<=5),'-') ,CAPEXType,Description)) ,
SUM({<Year = {"$(=MAX(Year))"},Month,Date = {"<=$(=DATE(MAX(Date)))"}>} Actual) *
PurgeChar((rank(SUM({<Year = {"$(=MAX(Year))"},Month,Date = {"<=$(=DATE(MAX(Date)))"}>} Actual))<=5),'-')
)
- Mark as New
- Bookmark
- Subscribe
- Mute
- Subscribe to RSS Feed
- Permalink
- Report Inappropriate Content
Hi Susant,
Thanks for your proposed solution. I'll use it if the users would like to view the chart simpler.
Cheers,
Adam Ginza
- « Previous Replies
-
- 1
- 2
- Next Replies »