Unlock a world of possibilities! Login now and discover the exclusive benefits awaiting you.
- Qlik Community
- :
- All Forums
- :
- QlikView App Dev
- :
- Accum Sales Budget by Day of Month based on LY Sal...
- Subscribe to RSS Feed
- Mark Topic as New
- Mark Topic as Read
- Float this Topic for Current User
- Bookmark
- Subscribe
- Mute
- Printer Friendly Page
- Mark as New
- Bookmark
- Subscribe
- Mute
- Subscribe to RSS Feed
- Permalink
- Report Inappropriate Content
Accum Sales Budget by Day of Month based on LY Sales by Day Accum
Hi Community
I would like an Accumulating 3 x Line Chart with Day of Month on X-Axis;
- Last Year Sales (LY)
- This Year Sales (TY)
- Budget
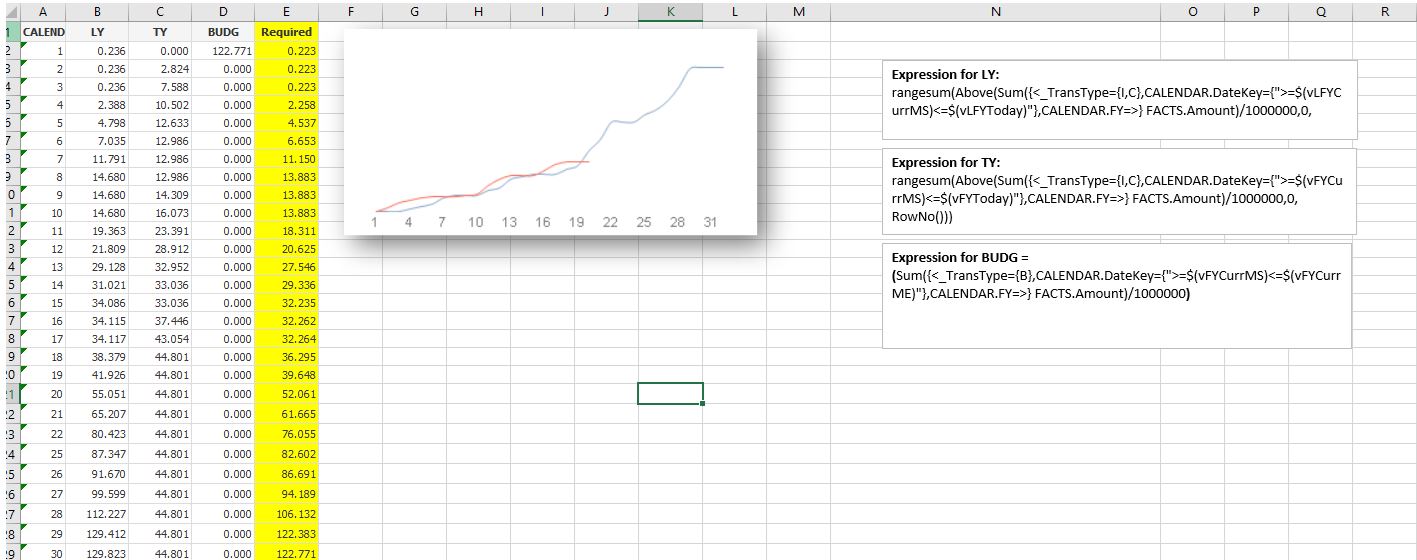
Problem: Our Budget in the dB is on 1st Day of Month only.
Required: Accumulate Budget by Day of Month; based on the LY Accumulating % (LY / Total LY as %)
Excel Example Attached. As you can see in excel I managed to trend the single Budget entry on 1st of Month vs LY Sales as % of Total LY Sales Accum.
Accepted Solutions
- Mark as New
- Bookmark
- Subscribe
- Mute
- Subscribe to RSS Feed
- Permalink
- Report Inappropriate Content
Hi,
I think the pattern you will need to use will involve using TOTAL and taking Sum and dividing by Count, so similar to the below, you will need to put back in the bits of your set analysis that pick the month/year vs prior year (and scaling) & not sure how this would handle showing more than 1 month;
rangesum(above(sum(TOTAL {<TransType={'B'}>}Amount)/Count(TOTAL DISTINCT DateKey),0,RowNo()))

Cheers,
Chris.
- Mark as New
- Bookmark
- Subscribe
- Mute
- Subscribe to RSS Feed
- Permalink
- Report Inappropriate Content
Hi,
I think the pattern you will need to use will involve using TOTAL and taking Sum and dividing by Count, so similar to the below, you will need to put back in the bits of your set analysis that pick the month/year vs prior year (and scaling) & not sure how this would handle showing more than 1 month;
rangesum(above(sum(TOTAL {<TransType={'B'}>}Amount)/Count(TOTAL DISTINCT DateKey),0,RowNo()))
Cheers,
Chris.