Unlock a world of possibilities! Login now and discover the exclusive benefits awaiting you.
- Qlik Community
- :
- All Forums
- :
- QlikView App Dev
- :
- Accumulative sum till current month
- Subscribe to RSS Feed
- Mark Topic as New
- Mark Topic as Read
- Float this Topic for Current User
- Bookmark
- Subscribe
- Mute
- Printer Friendly Page
- Mark as New
- Bookmark
- Subscribe
- Mute
- Subscribe to RSS Feed
- Permalink
- Report Inappropriate Content
Accumulative sum till current month
Hi all,
I'm having some trouble figuring the following out.
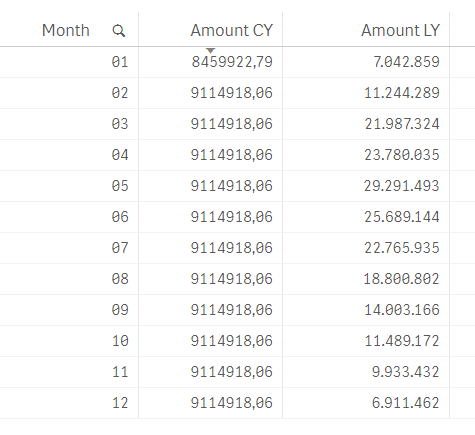
I have a accumulation per month of sum(amount) for the current year and previous year. But my line chart for the current year should stop at the current month.
I've used the following formula for the calculation of the accumulation:
rangesum(above(Sum({<Year={$(=max(Year))}>}Amount),0,rowno()))
The calculation works just fine. See the results in the table below:

As a result my linechart looks like this:

But my client wants the Amount CY line to stop at month 02.
Is there a way to get this done?
Thank you in advance!
Accepted Solutions
- Mark as New
- Bookmark
- Subscribe
- Mute
- Subscribe to RSS Feed
- Permalink
- Report Inappropriate Content
add an if()
=if(Month <= Month(today()) , rangesum(above(Sum({<Year={$(=max(Year))}>}Amount),0,rowno())))
If a post helps to resolve your issue, please accept it as a Solution.
- Mark as New
- Bookmark
- Subscribe
- Mute
- Subscribe to RSS Feed
- Permalink
- Report Inappropriate Content
add an if()
=if(Month <= Month(today()) , rangesum(above(Sum({<Year={$(=max(Year))}>}Amount),0,rowno())))
If a post helps to resolve your issue, please accept it as a Solution.
- Mark as New
- Bookmark
- Subscribe
- Mute
- Subscribe to RSS Feed
- Permalink
- Report Inappropriate Content
or give this a try
=rangesum(above(Sum({<Year={$(=max(Year))} , Month = {"<=$(=Month(Today()))"}>}Amount),0,rowno())))
If a post helps to resolve your issue, please accept it as a Solution.
- Mark as New
- Bookmark
- Subscribe
- Mute
- Subscribe to RSS Feed
- Permalink
- Report Inappropriate Content
Thank you so much Vineeth!
I tried several things but I must have missed this one.