Unlock a world of possibilities! Login now and discover the exclusive benefits awaiting you.
- Qlik Community
- :
- All Forums
- :
- QlikView App Dev
- :
- Adding expression based on alternative state
- Subscribe to RSS Feed
- Mark Topic as New
- Mark Topic as Read
- Float this Topic for Current User
- Bookmark
- Subscribe
- Mute
- Printer Friendly Page
- Mark as New
- Bookmark
- Subscribe
- Mute
- Subscribe to RSS Feed
- Permalink
- Report Inappropriate Content
Adding expression based on alternative state
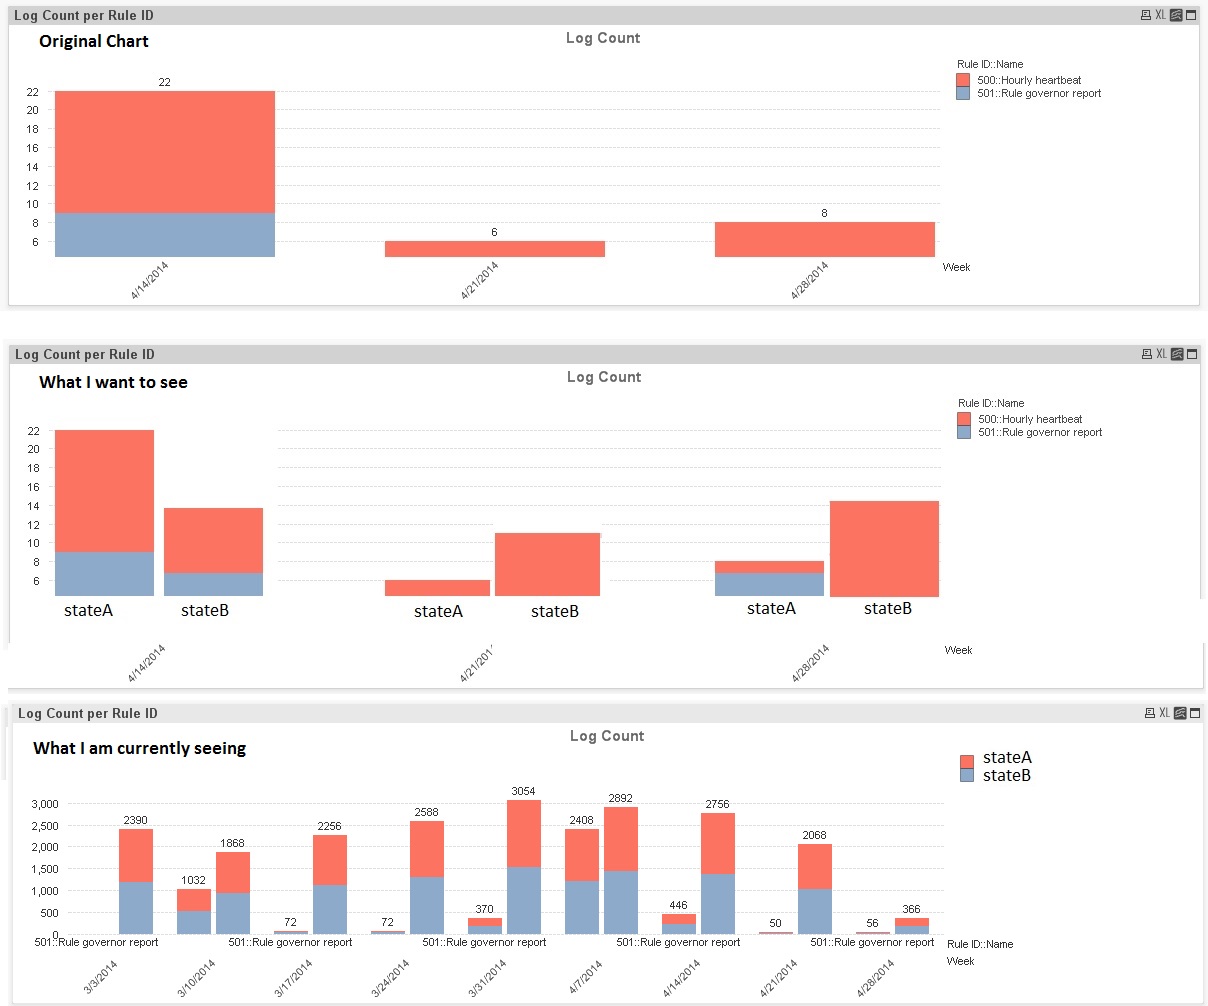
I have a stacked bar chart with two dimensions:
1) Date - shown along the X axis as a bar chart
2) Rule name - shown in the legend (stacked on each date bar with sum at top)
And one expression:
1) Count the number of logs generated by each rule
Now I need to add the ability to compare two states using separate bars, yet keep the formatting the same. So, I tried the following:
Dimensions:
1) Date (same)
2) Rule Name (same)
Expression:
1) Count {[StateA]} - same expression
2) Count {[StateB]} - same expression
But this results in the two stated being displayed in the legend with the rules listed long the X axis along with the dates. How do I make it so the two states are displayed along the X axis and the rules remain in the legend and stacked? Simple screenshots below for better description:
- Mark as New
- Bookmark
- Subscribe
- Mute
- Subscribe to RSS Feed
- Permalink
- Report Inappropriate Content
Maybe like attached, using a third calculated synthetic dimension for the state view.
- Mark as New
- Bookmark
- Subscribe
- Mute
- Subscribe to RSS Feed
- Permalink
- Report Inappropriate Content
Or like this with a bit more intuitive dimension filtering.