Unlock a world of possibilities! Login now and discover the exclusive benefits awaiting you.
- Qlik Community
- :
- All Forums
- :
- QlikView App Dev
- :
- Re: Adding the Previous Week or Rangesum Question
- Subscribe to RSS Feed
- Mark Topic as New
- Mark Topic as Read
- Float this Topic for Current User
- Bookmark
- Subscribe
- Mute
- Printer Friendly Page
- Mark as New
- Bookmark
- Subscribe
- Mute
- Subscribe to RSS Feed
- Permalink
- Report Inappropriate Content
Adding the Previous Week or Rangesum Question
Hello! Pls. help me solve my rangesum formula. I have a dimensional field that I make them into 60 weekly buckets. I'm trying to compute the net variance as shown below :
| Week Numbers | Wk1 | Wk2 | Wk3 | Wk4 | Wk5 | Wk6 | Wk7 | Wk8 | Wk9 | Wk10 | Wk11 | Wk12 | Wk13 |
| Demand | 0 | 1000 | 0 | 2000 | 5000 | 1000 | 2000 | 0 | 2000 | 1000 | 1000 | 3000 | 2000 |
| Supply | 1000 | 0 | 0 | 5000 | 0 | 0 | 2000 | 0 | 8000 | 0 | 2000 | 0 | |
| Variance | 1000 | 0 | 0 | -2000 | 0 | -1000 | -2000 | 2000 | 0 | 7000 | 6000 | 5000 | 3000 |
| Formula for Variance | Supply-Demand | If prev week > 0, Supply - Demand +prev week,Supply - Demand) | same as Wk2 | same as Wk2 | same as Wk2 |
I tried using the rangesum formula but the results is different from what I want to achieve. If you see below Week 5 , it's -2000 since the -2000 from week 4, got carried over...This should be 0 as shown in the above table.
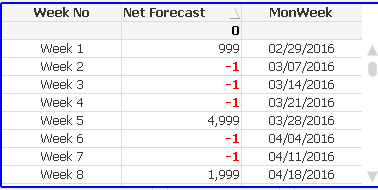
| Week No | Week 1 | Week 2 | Week 3 | Week 4 | Week 5 | Week 6 | Week 7 | Week 8 | Week 9 |
| MonWeek | 02/29/2016 | 03/07/2016 | 03/14/2016 | 03/21/2016 | 03/28/2016 | 04/04/2016 | 04/11/2016 | 04/18/2016 | 04/25/2016 |
| Variance | 1,000 | 0 | 0 | -2,000 | -2,000 | -3,000 | -5,000 | -6,000 | -8,000 |
Thank you in advance.
- Mark as New
- Bookmark
- Subscribe
- Mute
- Subscribe to RSS Feed
- Permalink
- Report Inappropriate Content
Try a straight table chart with dimension WeekNo and as expression
=Rangesum(Above( Sum(Supply),0,Rowno() )) - Rangesum(Above( Sum( Demand),0,Rowno() ))
If you are using a pivot table chart, you may need to use Before() instead of Above(). If you add more dimensions. you may need to add the TOTAL qualifier to RowNo(TOTAL) and Above(TOTAL ...)
- Mark as New
- Bookmark
- Subscribe
- Mute
- Subscribe to RSS Feed
- Permalink
- Report Inappropriate Content
hi! Swuehl,
I tried the straight table the results are still different....but I need the results in pivot table though...
I tried to replace above with before since I want to be in pivot table but I get a different results too. Also, would appreciate if you could givethe exact formula with the Total qualifier if I add another 2 dimensions like Monweek and Materials... Sorry but this is new to me and first time to do such a thing.

Thank you for your prompt response.
- Mark as New
- Bookmark
- Subscribe
- Mute
- Subscribe to RSS Feed
- Permalink
- Report Inappropriate Content
Ok, if you want to use a pivot table, you also may need to change RowNo() to ColumnNo() if pivoted.
I used this to load in your excel sheet data:
LOAD [Week Numbers],
Demand,
Supply
FROM
(ooxml, embedded labels, table is Sheet2, filters(
Remove(Row, Pos(Top, 6)),
Remove(Row, Pos(Top, 5)),
Remove(Row, Pos(Top, 4)),
Transpose()
));
Then I created a pivot table chart with dimension Week Numbers and as expression:
=Rangesum(Before(Sum(Supply),0, ColumnNo() )) -RangeSum(Before(Sum(Demand),0,ColumnNo()))
- Mark as New
- Bookmark
- Subscribe
- Mute
- Subscribe to RSS Feed
- Permalink
- Report Inappropriate Content
Swuehl,
I got the right numbers using the formula...But is there any way to add condition that if previous week > 0 ,
Supply - Demand + Prev Week (current rangesum formula)....If Previous week < 0 , Supply - Demand....The rangesum should stop if the previous week is > 0, then start the rangesum again...
Tks.
| Week Numbers | Wk1 | Wk2 | Wk3 | Wk4 | Wk5 | Wk6 | Wk7 | Wk8 | Wk9 | Wk10 | Wk11 | Wk12 | Wk13 |
| Demand | 0 | 1000 | 0 | 2000 | 5000 | 1000 | 2000 | 0 | 2000 | 1000 | 1000 | 3000 | 2000 |
| Supply | 1000 | 0 | 0 | 5000 | 0 | 0 | 2000 | 0 | 8000 | 0 | 2000 | 0 | |
| Variance | 1000 | 0 | 0 | -2000 | 0 | -1000 | -2000 | 2000 | 0 | 7000 | 6000 | 5000 | 3000 |
| Formula for Variance | Supply-Demand | If prev week > 0, Supply - Demand +prev week,Supply - Demand) | same as Wk2 | same as Wk2 | same as Wk2 |
- Mark as New
- Bookmark
- Subscribe
- Mute
- Subscribe to RSS Feed
- Permalink
- Report Inappropriate Content
Maybe like this?