Unlock a world of possibilities! Login now and discover the exclusive benefits awaiting you.
- Qlik Community
- :
- All Forums
- :
- QlikView App Dev
- :
- Align line chart to y-axis leaving no gap between ...
- Subscribe to RSS Feed
- Mark Topic as New
- Mark Topic as Read
- Float this Topic for Current User
- Bookmark
- Subscribe
- Mute
- Printer Friendly Page
- Mark as New
- Bookmark
- Subscribe
- Mute
- Subscribe to RSS Feed
- Permalink
- Report Inappropriate Content
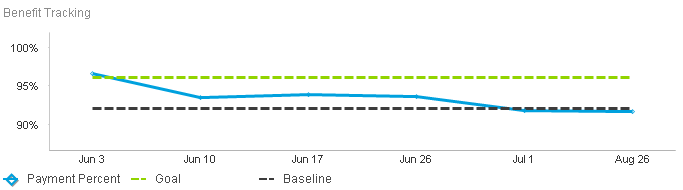
Align line chart to y-axis leaving no gap between y-axis and first data point
Hello QlikCommunity,
I have what seems to be a relatively simple request, but I can't see to make it happen. I would like to limit the white space between the y-axis of my chart at the first point on my line chart. Does anyone know how I can make this work?
I have pictures here to show you what I'm looking for.
This is my current chart, notice the gap between the y-axis and Jun 3.
What I have done is photshopped my chart so that it looks like my desired outcome.

How can I make this happen in Qlikview?
Thanks all,
Alex
- Mark as New
- Bookmark
- Subscribe
- Mute
- Subscribe to RSS Feed
- Permalink
- Report Inappropriate Content
Hi Alex,
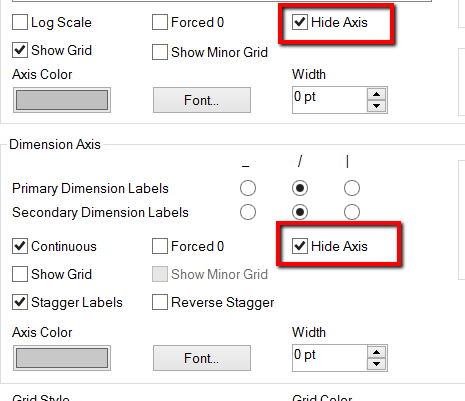
You can click the Hide the primary and Seconday Axes in the Axes Tab of the Chart Properties
- Mark as New
- Bookmark
- Subscribe
- Mute
- Subscribe to RSS Feed
- Permalink
- Report Inappropriate Content
Hi Alan,
Thanks for the quick response. This would definitely work, but then, obviously, I no longer have either axis showing. My X-axis is made of distinct time periods and cannot be calculated across a continuous axis.
Is there no way to just bring the Y-axis in to my first dimension and keep it showing?
Alex
- Mark as New
- Bookmark
- Subscribe
- Mute
- Subscribe to RSS Feed
- Permalink
- Report Inappropriate Content
Hi Alex,
Set the Y-Axis to Continuous and then set the scale to a Static Min of the dimension (in my case OrderDate)
Hope that helps,
Josh
![2013-11-06 15_15_03-Chart Properties [Sales By Month].png](/legacyfs/online/48663_2013-11-06 15_15_03-Chart Properties [Sales By Month].png)