Unlock a world of possibilities! Login now and discover the exclusive benefits awaiting you.
- Qlik Community
- :
- All Forums
- :
- QlikView App Dev
- :
- Alternate States in a Bar Chart
- Subscribe to RSS Feed
- Mark Topic as New
- Mark Topic as Read
- Float this Topic for Current User
- Bookmark
- Subscribe
- Mute
- Printer Friendly Page
- Mark as New
- Bookmark
- Subscribe
- Mute
- Subscribe to RSS Feed
- Permalink
- Report Inappropriate Content
Alternate States in a Bar Chart
I have a document with two alternate states. Each Alternate state has the same selection boxes so that I can compare two different selection scenarios together. I would like to have both selections show up on a chart. What I am looking to do is to have one bar chart combining both. The X axis will have "Categories" and the Y axis will have "sales." Each category can have two values in the Y axis "sales." The basic formula is Sum({[State 1]} Sales) and Sum({[State 2]} Sales). I want the bar to be the space between the two points here.
Any chance you can help me figure out how to apply this to my document?
- Mark as New
- Bookmark
- Subscribe
- Mute
- Subscribe to RSS Feed
- Permalink
- Report Inappropriate Content
Hey Jeremy -
I am not 100% sure I understand what you are trying to do. Can you may be elaborate a little>?
- Mark as New
- Bookmark
- Subscribe
- Mute
- Subscribe to RSS Feed
- Permalink
- Report Inappropriate Content
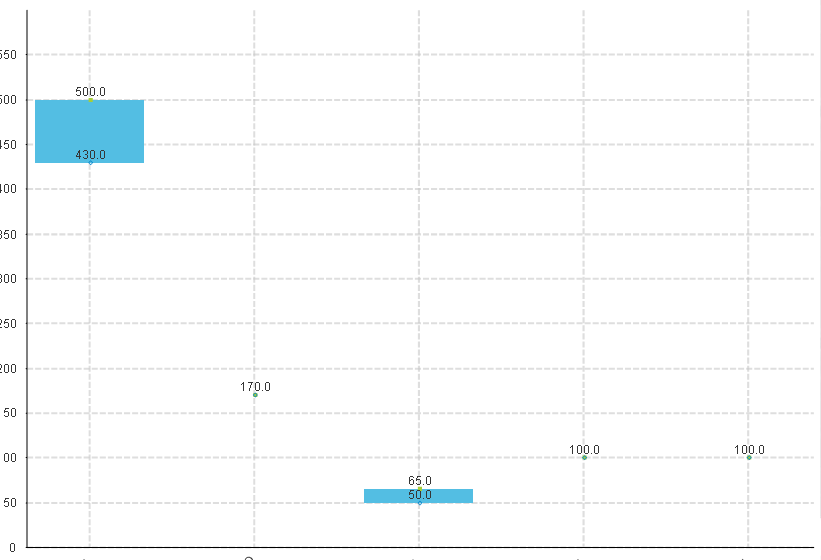
I have gotten partially there but it is not quite right. The selection from state one is the 500.0 below and the selection from state 2 is 430.0. The blue is the difference between the two with the bar offset as the lower amount. However this will not work if the state 2 figure is greater than state 1. Can you help me with creating an if statement to cover this?

- Mark as New
- Bookmark
- Subscribe
- Mute
- Subscribe to RSS Feed
- Permalink
- Report Inappropriate Content
I reposted to the note, but I don't know if it would get to you.
I have gotten partially there but it is not quite right. The selection from state one is the 500.0 below and the selection from state 2 is 430.0. The blue is the difference between the two with the bar offset as the lower amount. However this will not work if the state 2 figure is greater than state 1. Can you help me with creating an if statement to cover this?
- Mark as New
- Bookmark
- Subscribe
- Mute
- Subscribe to RSS Feed
- Permalink
- Report Inappropriate Content
May be like this
Offset expression:
RangeMin(Expression1, Expression2)