Unlock a world of possibilities! Login now and discover the exclusive benefits awaiting you.
- Qlik Community
- :
- All Forums
- :
- QlikView App Dev
- :
- Alternates states to compare highest 5 values in c...
- Subscribe to RSS Feed
- Mark Topic as New
- Mark Topic as Read
- Float this Topic for Current User
- Bookmark
- Subscribe
- Mute
- Printer Friendly Page
- Mark as New
- Bookmark
- Subscribe
- Mute
- Subscribe to RSS Feed
- Permalink
- Report Inappropriate Content
Alternates states to compare highest 5 values in current month to the same values in previous month
Hi All
can we define alternate states dynamically
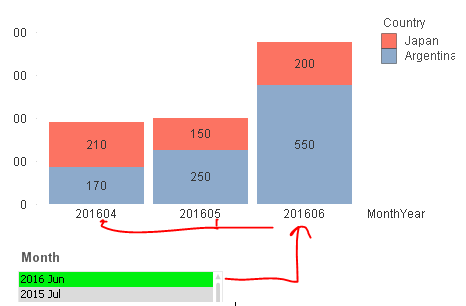
i have a requiremnt,where i have to compare,the selected month top 5 values,to the same values in previous month.
i can give two list boxes to the end user but he dont want in that way
when he selects a particular month he need to com[pare the top 5 values in the current month to the same values in previous month as below
- « Previous Replies
-
- 1
- 2
- Next Replies »
- Mark as New
- Bookmark
- Subscribe
- Mute
- Subscribe to RSS Feed
- Permalink
- Report Inappropriate Content
Here, You've hit the 2016 Jun. From This what are you expecting the Labels for Dim
- Mark as New
- Bookmark
- Subscribe
- Mute
- Subscribe to RSS Feed
- Permalink
- Report Inappropriate Content
Hi all Please help me out top two values in current month comparing the same with previous month.
In June the top two profitted cuntries are Argentina and Japan
In May the top two profitted cuntries are America and Argentina
What i want is when i click on jun i want both june and may data to dispaly and the comparision should be between the selected month (jun) and top two values of it Argentina and Japan to Argentina and Japanin May
- Mark as New
- Bookmark
- Subscribe
- Mute
- Subscribe to RSS Feed
- Permalink
- Report Inappropriate Content
it will be helpful if you give me a sample
- Mark as New
- Bookmark
- Subscribe
- Mute
- Subscribe to RSS Feed
- Permalink
- Report Inappropriate Content
Hi John
Did you solve your issue ? let me know, otherwise i build for en example?
beck
- Mark as New
- Bookmark
- Subscribe
- Mute
- Subscribe to RSS Feed
- Permalink
- Report Inappropriate Content
Month products city
Jan 2016 10 tokyo
Jan 2016 25 newyork
Jan 2016 45 brazil
Feb 2016 30 hongkong
Feb 2016 15 tokyo
Feb 2016 20 newyork
My requirement is i have a bar chart
I'm calculating sum of products in a particular month
I have applied dimension limits to it show largest 2 values
In january it shows brazil and newyork
In february it shows newyork and hongkong
What i want is i want to compare the top 2 values which are in january to feb ie in feb i want to see brazil and newyork but not newyork and hongkong
- Mark as New
- Bookmark
- Subscribe
- Mute
- Subscribe to RSS Feed
- Permalink
- Report Inappropriate Content
Hi beck it would be of great help from your side
Month products city
Jan 2016 10 tokyo
Jan 2016 25 newyork
Jan 2016 45 brazil
Feb 2016 30 hongkong
Feb 2016 15 tokyo
Feb 2016 20 newyork
My requirement is i have a bar chart
I'm calculating sum of products in a particular month
I have applied dimension limits to it show largest 2 values
In january it shows brazil and newyork
In february it shows newyork and hongkong
What i want is i want to compare the top 2 values which are in january to feb ie in feb i want to see brazil and newyork but not newyork and hongkong
I was bit struggling with these
- Mark as New
- Bookmark
- Subscribe
- Mute
- Subscribe to RSS Feed
- Permalink
- Report Inappropriate Content
Hi John,
i created an example, take a look and please give me your Feedback,
i hope that helps to resolve your issue
beck
- Mark as New
- Bookmark
- Subscribe
- Mute
- Subscribe to RSS Feed
- Permalink
- Report Inappropriate Content
You have to use p() in set expression like:
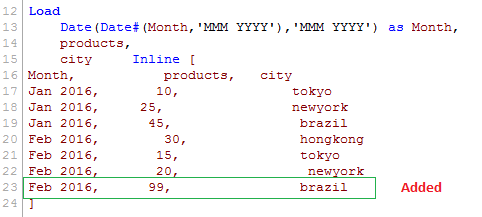
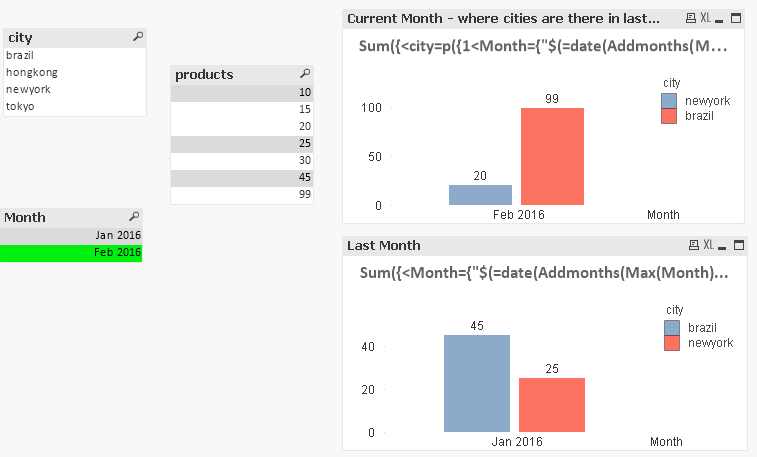
Exp1: Sum({<city=p({1<Month={"$(=date(Addmonths(Max(Month),-1),'MMM YYYY'))"}>}city)>}products)
Exp2: Sum({<Month={"$(=date(Addmonths(Max(Month),-1),'MMM YYYY'))"}>}products)
- Mark as New
- Bookmark
- Subscribe
- Mute
- Subscribe to RSS Feed
- Permalink
- Report Inappropriate Content
Hi John?
Have you solved your issue?
beck
- « Previous Replies
-
- 1
- 2
- Next Replies »
