Unlock a world of possibilities! Login now and discover the exclusive benefits awaiting you.
- Qlik Community
- :
- All Forums
- :
- QlikView App Dev
- :
- Re: Avarage value in straight table is not working
- Subscribe to RSS Feed
- Mark Topic as New
- Mark Topic as Read
- Float this Topic for Current User
- Bookmark
- Subscribe
- Mute
- Printer Friendly Page
- Mark as New
- Bookmark
- Subscribe
- Mute
- Subscribe to RSS Feed
- Permalink
- Report Inappropriate Content
Avarage value in straight table is not working
Hi
I ahve scenario,
I need to show records of latest month in straight table.
In that i need show trend of last 6 months and 3 months based on user selection of rate column.
I am not bale to show trend of last 3,6 months ,Please guide me for that.
Please do the needful
- « Previous Replies
-
- 1
- 2
- Next Replies »
Accepted Solutions
- Mark as New
- Bookmark
- Subscribe
- Mute
- Subscribe to RSS Feed
- Permalink
- Report Inappropriate Content
May be one of the two expression, with just Country as dimension
Dimension
Country
Expression
1) =Sum({<YearMonth={"$(=Date(MakeDate(2017, 4, 25), 'YYYY/MM/DD'))"}>} Sales)
2)
Option 1
=AVG({<YearMonth={"$(='>=' & Date(AddMonths(Date(V_DB_Max_date),-(Value-1)), 'YYYY/MM/DD') & '<=' & Date(V_DB_Max_date, 'YYYY/MM/DD'))"}>} Rate)/100
Option 2
=AVG({<YearMonth={"$(='>=' & Date(AddMonths(Date(V_DB_Max_date),-(Value-1)), 'YYYY/MM/DD') & '<=' & Date(V_DB_Max_date, 'YYYY/MM/DD'))"}, Rate = {'>0'}>} Rate)/100
- Mark as New
- Bookmark
- Subscribe
- Mute
- Subscribe to RSS Feed
- Permalink
- Report Inappropriate Content
Hi,
please check in Variable(V_DB_Max_date) is not working,if u want check in input Box.
do like this V_DB_Max_date==max(YearMonth)
- Mark as New
- Bookmark
- Subscribe
- Mute
- Subscribe to RSS Feed
- Permalink
- Report Inappropriate Content
sorry
do like this
V_DB_Max_date=max(YearMonth)
may i know the logic for avg.
- Mark as New
- Bookmark
- Subscribe
- Mute
- Subscribe to RSS Feed
- Permalink
- Report Inappropriate Content
Hi Mahesh,
After adding '= ' in variable then text object is working but straight table in not working.
Logic is end user wnt to see the trend of last couple of months based on his selection .
Thanks
Thiru
- Mark as New
- Bookmark
- Subscribe
- Mute
- Subscribe to RSS Feed
- Permalink
- Report Inappropriate Content
Can you rerun the application and see if it works... made some script changes
- Mark as New
- Bookmark
- Subscribe
- Mute
- Subscribe to RSS Feed
- Permalink
- Report Inappropriate Content
Hi Sunny,
Here also in text box it is working and straight table (Trend column) it is not working.
Might be
Cause:i am taking only latest column in dimension formula.
Please do the needful
Thanks
Thiru
- Mark as New
- Bookmark
- Subscribe
- Mute
- Subscribe to RSS Feed
- Permalink
- Report Inappropriate Content
Can you attach the refreshed version of the app (with my changes)
- Mark as New
- Bookmark
- Subscribe
- Mute
- Subscribe to RSS Feed
- Permalink
- Report Inappropriate Content
Hi Sunny,
Please find the attachment with rerun data
Thanks
Thiru
- Mark as New
- Bookmark
- Subscribe
- Mute
- Subscribe to RSS Feed
- Permalink
- Report Inappropriate Content
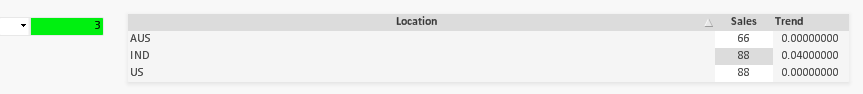
Do you expect to see 0.04 for IND?
- Mark as New
- Bookmark
- Subscribe
- Mute
- Subscribe to RSS Feed
- Permalink
- Report Inappropriate Content
Hi Sunny,
yes.
But it should be vary as per the value selection i.e. 3 and 6 and 9 .
how it is changing in text box same way it needs to be change in straight tabel.
Regards
Thiru
- « Previous Replies
-
- 1
- 2
- Next Replies »