Unlock a world of possibilities! Login now and discover the exclusive benefits awaiting you.
- Qlik Community
- :
- All Forums
- :
- QlikView App Dev
- :
- Re: Average Sales based on month selection
Options
- Subscribe to RSS Feed
- Mark Topic as New
- Mark Topic as Read
- Float this Topic for Current User
- Bookmark
- Subscribe
- Mute
- Printer Friendly Page
Turn on suggestions
Auto-suggest helps you quickly narrow down your search results by suggesting possible matches as you type.
Showing results for
Not applicable
2017-01-16
12:58 AM
- Mark as New
- Bookmark
- Subscribe
- Mute
- Subscribe to RSS Feed
- Permalink
- Report Inappropriate Content
Average Sales based on month selection
Hi All,
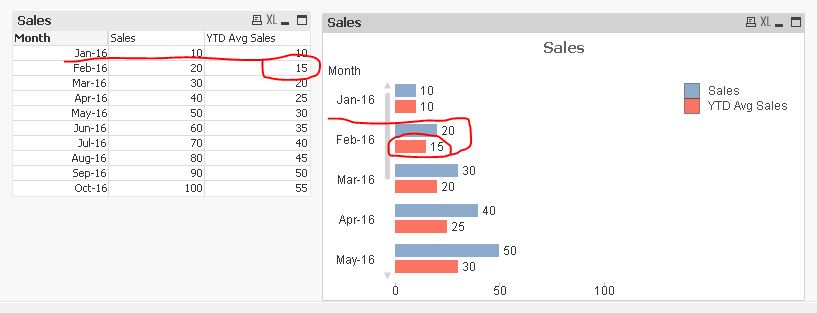
I want to show YTD Sales Average for Dept1 in a pivot table with month selection as shown below:
| Month | Sales | YTD Avg Sales |
| Jan-16 | 10 | 10 |
| Feb-16 | 20 | 15 |
| Mar-16 | 30 | 20 |
| Apr-16 | 40 | 25 |
| May-16 | 50 | 30 |
| Jun-16 | 60 | 35 |
| Jul-16 | 70 | 40 |
| Aug-16 | 80 | 45 |
| Sep-16 | 90 | 50 |
| Oct-16 | 100 | 55 |
Please help me. Thanks in advance.
- « Previous Replies
-
- 1
- 2
- Next Replies »
12 Replies
MVP
2017-01-16
02:27 AM
- Mark as New
- Bookmark
- Subscribe
- Mute
- Subscribe to RSS Feed
- Permalink
- Report Inappropriate Content
Have you tried : Aggr(Rangeavg(Above( sum({<Month>}Sales),0,RowNo())), Dept,Month) ?
Partner - Specialist
2017-01-16
02:32 AM
- Mark as New
- Bookmark
- Subscribe
- Mute
- Subscribe to RSS Feed
- Permalink
- Report Inappropriate Content
Hi,
But I have checked that the value of YTD Avg Sales are same for both chart.
Please find the below screen shot for the ready reference
Warm Regards,
Susovan
Susovan
Not applicable
2017-01-16
02:56 AM
Author
- Mark as New
- Bookmark
- Subscribe
- Mute
- Subscribe to RSS Feed
- Permalink
- Report Inappropriate Content
tresesco,Taking much time to calculate even with less data.Is there another way to do same calculation ?
Aggr(Rangeavg(Above( sum({<Month>}Sales),0,RowNo())),Dept,Month)

259 Views
- « Previous Replies
-
- 1
- 2
- Next Replies »