Unlock a world of possibilities! Login now and discover the exclusive benefits awaiting you.
- Qlik Community
- :
- All Forums
- :
- QlikView App Dev
- :
- Average, % of Quota by all dimentions in Pivot Tab...
- Subscribe to RSS Feed
- Mark Topic as New
- Mark Topic as Read
- Float this Topic for Current User
- Bookmark
- Subscribe
- Mute
- Printer Friendly Page
- Mark as New
- Bookmark
- Subscribe
- Mute
- Subscribe to RSS Feed
- Permalink
- Report Inappropriate Content
Average, % of Quota by all dimentions in Pivot Table
Hi frends!
Help me to write right expression to calculate "Quota" value by all dimentions.
Expression I'm using looks like:
Avg(
  Aggr(
  Sum ( TOTAL<Collection,Category,Group, Subgroup> Quota )
  ,Collection,Category,Group, Subgroup)
  )
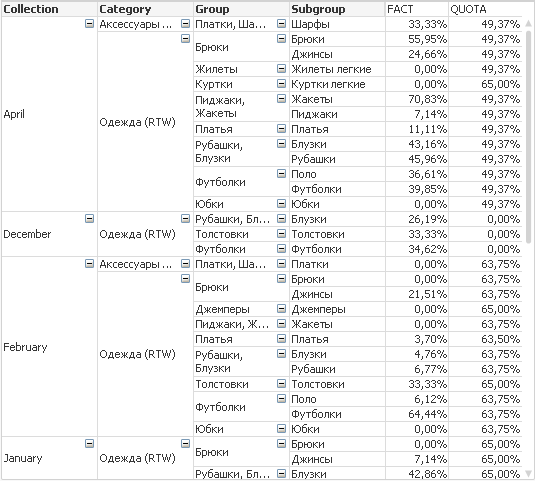
I'm using pivot table:

Expression works fine on Subgroups level. But when we drill down to Group, Category and Collection it stops calculate AVG(...) rightly.
For example
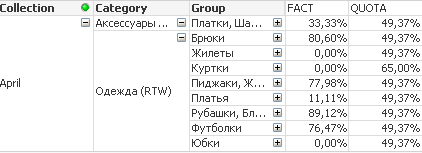
Collection: April. If i drill down to Group i've got the next view:

If we look at Categorty: "Одежда (RTW)" and drill down to Category we need to get average "Quota" - 51,33 %.
But what we have:

???? It's wrong.
The same thing with Collection.
How to get average from the last granular lever "Subgroup" for all dimentions "Collection", "Category", "Group" ???
Or how to calculate the average as I wrote for example for Collection "April" and Category "Одежда (RTW)" - 51,33% ???
Please help! May be any advices?
P.S.: Source .qvw in attachment.
Thanks in advance.
Accepted Solutions
- Mark as New
- Bookmark
- Subscribe
- Mute
- Subscribe to RSS Feed
- Permalink
- Report Inappropriate Content
Hi,
Why do you think, you should get 51,33%?
I feel 50, 68 is correct, as average happens within underlying data rather than just summing up 8 cells value and dividing it by 8.
Please let me know, if your requirement is different.
Thanks,
Vinod Kumar V