Unlock a world of possibilities! Login now and discover the exclusive benefits awaiting you.
- Qlik Community
- :
- All Forums
- :
- QlikView App Dev
- :
- Re: Avg line!
- Subscribe to RSS Feed
- Mark Topic as New
- Mark Topic as Read
- Float this Topic for Current User
- Bookmark
- Subscribe
- Mute
- Printer Friendly Page
- Mark as New
- Bookmark
- Subscribe
- Mute
- Subscribe to RSS Feed
- Permalink
- Report Inappropriate Content
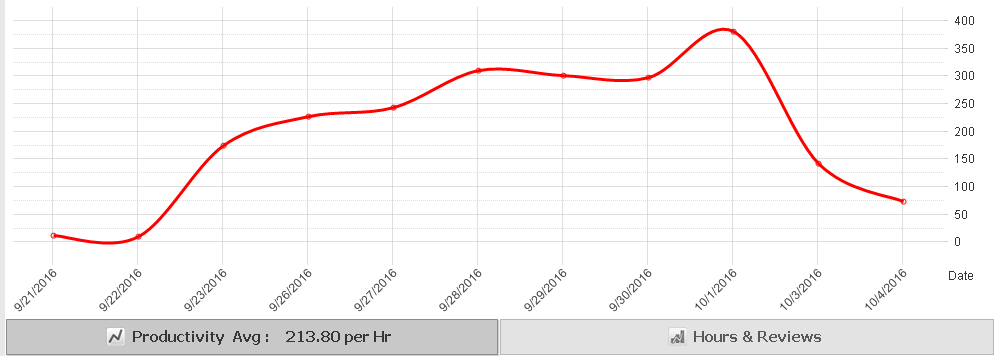
Avg line!
Hi!
This is a productivity calculation for each date!
I simply divided 'count' for each day by 'hour' for each day.
I want to have a reference line that will have overall productivity.
if I just use a trend line avg selection, it just gives back the avg of data points for each date.
but that's not what I want.
I want entire counts for all days divided by entire hours for all days and have a line that goes across the table horizontally.
if I could put in a line that is free from effect of dimension, it will solve the issue.
but i guess there could also be other ways.
Please help!
thank you in advance!!! 
David
- Mark as New
- Bookmark
- Subscribe
- Mute
- Subscribe to RSS Feed
- Permalink
- Report Inappropriate Content
May be like this:
Sum(TOTAL Count)/Sum(TOTAL Hours)
- Mark as New
- Bookmark
- Subscribe
- Mute
- Subscribe to RSS Feed
- Permalink
- Report Inappropriate Content
I simply divided 'count' for each day by 'hour' for each day.
For Single Day What you've tried. i mean which expression you've written.
- Mark as New
- Bookmark
- Subscribe
- Mute
- Subscribe to RSS Feed
- Permalink
- Report Inappropriate Content
Hi,
you can use referenceline here to have a line a cross the chart.