Unlock a world of possibilities! Login now and discover the exclusive benefits awaiting you.
- Qlik Community
- :
- All Forums
- :
- QlikView App Dev
- :
- Axis values are hidden in Report Print Preview
- Subscribe to RSS Feed
- Mark Topic as New
- Mark Topic as Read
- Float this Topic for Current User
- Bookmark
- Subscribe
- Mute
- Printer Friendly Page
- Mark as New
- Bookmark
- Subscribe
- Mute
- Subscribe to RSS Feed
- Permalink
- Report Inappropriate Content
Axis values are hidden in Report Print Preview
Hi,
I have created a Report in one of my Qlikview files using the Report Editor option. The report consists of a chart and a number of table objects.
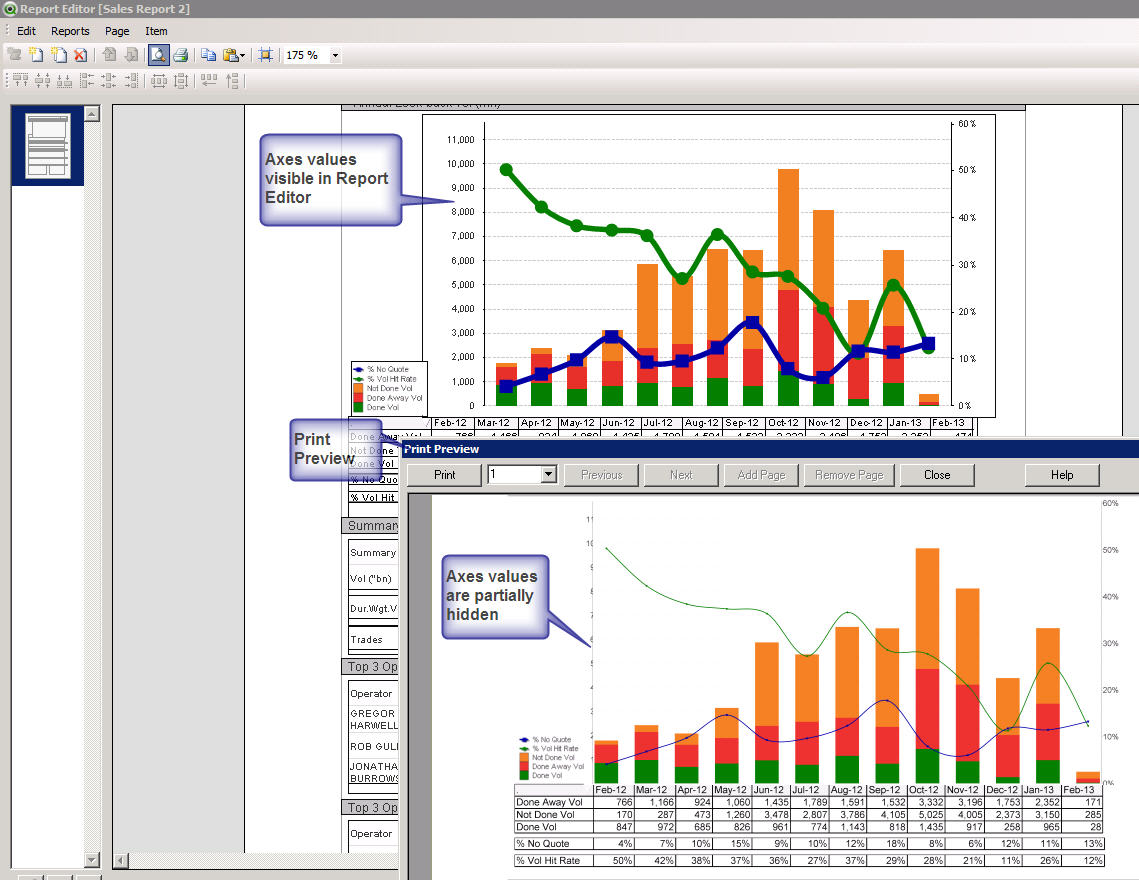
I have laid the chart on the Report Editor screen so that it is completely visible. However, when I see it in Print Preview (and also the printed report), the Y Axis values are appearing partially hidden by the axis line.
See attached screenshot which shows the problem

I have tried
- expanding the chart so it occupies the full page width
- hiding the axis line
- changing the object settings in the report to Clip, Fill and Fill with Aspect.
Please can someone help me with the settings I need to change to get this to appear correctly in the printed output.
Accepted Solutions
- Mark as New
- Bookmark
- Subscribe
- Mute
- Subscribe to RSS Feed
- Permalink
- Report Inappropriate Content
Hi,
Have you tried to reduce the chart size by selecting the chart and doing CTRL + SHIFT to reduce the chart size rather than the frame size?
- Mark as New
- Bookmark
- Subscribe
- Mute
- Subscribe to RSS Feed
- Permalink
- Report Inappropriate Content
Hi,
Have you tried to reduce the chart size by selecting the chart and doing CTRL + SHIFT to reduce the chart size rather than the frame size?
- Mark as New
- Bookmark
- Subscribe
- Mute
- Subscribe to RSS Feed
- Permalink
- Report Inappropriate Content
Thanks for the tip Bastien. I have managed to change the chart size and get the axis values to appear.
However, I still think you should see on Print Preview same as what you see on Edit Report.
- Mark as New
- Bookmark
- Subscribe
- Mute
- Subscribe to RSS Feed
- Permalink
- Report Inappropriate Content
I know... When using reports, what you see is not what you get unfortunately and sometimes aligning objects or resizing charts can be tricky as you just learned ![]()