Unlock a world of possibilities! Login now and discover the exclusive benefits awaiting you.
- Qlik Community
- :
- All Forums
- :
- QlikView App Dev
- :
- Bar Chart Help
- Subscribe to RSS Feed
- Mark Topic as New
- Mark Topic as Read
- Float this Topic for Current User
- Bookmark
- Subscribe
- Mute
- Printer Friendly Page
- Mark as New
- Bookmark
- Subscribe
- Mute
- Subscribe to RSS Feed
- Permalink
- Report Inappropriate Content
Bar Chart Help
Good morning all. I am stuck on creating a bar chart and wondered if you can pleae help.
Background:
5,000 receipts happened over two months. The basic data of ARRIVAL_DATE (Date transaction occurred) and RECEIPT_REFERENCE (transaction reference) is needed to make a graph - BUT I have not had much experience with this.
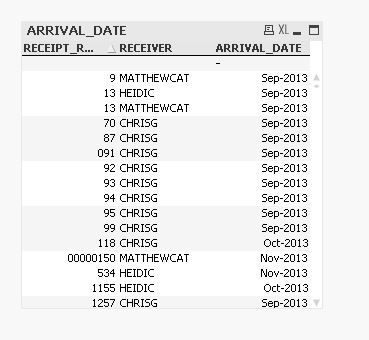
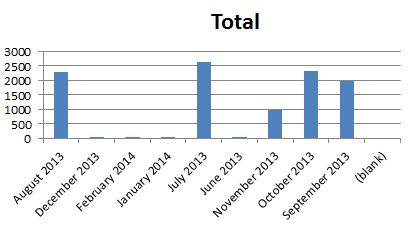
Basically, I want to create a graph with a different bar for each month (as the X axis), showing a count of the receipt references .
Similar to the below;
I am confused as to what should be a dimension and what should be an expression.
Can you please help?
cheers
- Tags:
- new_to_qlikview
Accepted Solutions
- Mark as New
- Bookmark
- Subscribe
- Mute
- Subscribe to RSS Feed
- Permalink
- Report Inappropriate Content
- Mark as New
- Bookmark
- Subscribe
- Mute
- Subscribe to RSS Feed
- Permalink
- Report Inappropriate Content
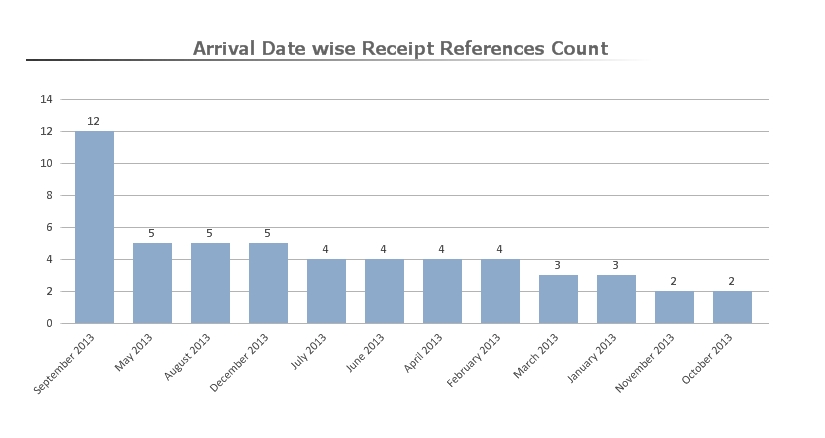
Try the ARRIVAL_DATE as the dimension and under the expression type in =count(RECEIPT_REFERENCE)
Hope this helps.
- Mark as New
- Bookmark
- Subscribe
- Mute
- Subscribe to RSS Feed
- Permalink
- Report Inappropriate Content
try this
AGGR(count(RECEIPT_REFERENCE),Month)
- Mark as New
- Bookmark
- Subscribe
- Mute
- Subscribe to RSS Feed
- Permalink
- Report Inappropriate Content
Hi Chris,
Please follow these steps:
- Right click--->New Sheet Object--> Charts
- Select Bar chart
- Select ARRIVAL_DATE as Dimension (Which belongs to X-axis)
- Write Count(RECEIPT_REFERENCE) in Expression
Thanks,
AMIT SAINI
- Mark as New
- Bookmark
- Subscribe
- Mute
- Subscribe to RSS Feed
- Permalink
- Report Inappropriate Content
Hi Chris
Check the Attachments
Regards
Aviral
- Mark as New
- Bookmark
- Subscribe
- Mute
- Subscribe to RSS Feed
- Permalink
- Report Inappropriate Content
hi
Dual(Month(MyDate) & '-' & Date(MyDate, 'YY'), Num(Year(MyDate)) & Num(Month(MyDate), '00')) AS MonthYear,
as dimension.
Note the Date(MyDate, 'YY') in the expression above.