Unlock a world of possibilities! Login now and discover the exclusive benefits awaiting you.
Announcements
NEW: Seamless Public Data Sharing with Qlik's New Anonymous Access Capability:
TELL ME MORE!
- Qlik Community
- :
- All Forums
- :
- QlikView App Dev
- :
- Bar chart label names on chart
Options
- Subscribe to RSS Feed
- Mark Topic as New
- Mark Topic as Read
- Float this Topic for Current User
- Bookmark
- Subscribe
- Mute
- Printer Friendly Page
Turn on suggestions
Auto-suggest helps you quickly narrow down your search results by suggesting possible matches as you type.
Showing results for
Not applicable
2016-01-21
10:23 PM
- Mark as New
- Bookmark
- Subscribe
- Mute
- Subscribe to RSS Feed
- Permalink
- Report Inappropriate Content
Bar chart label names on chart
Hi,
I am beginner in Qlik.
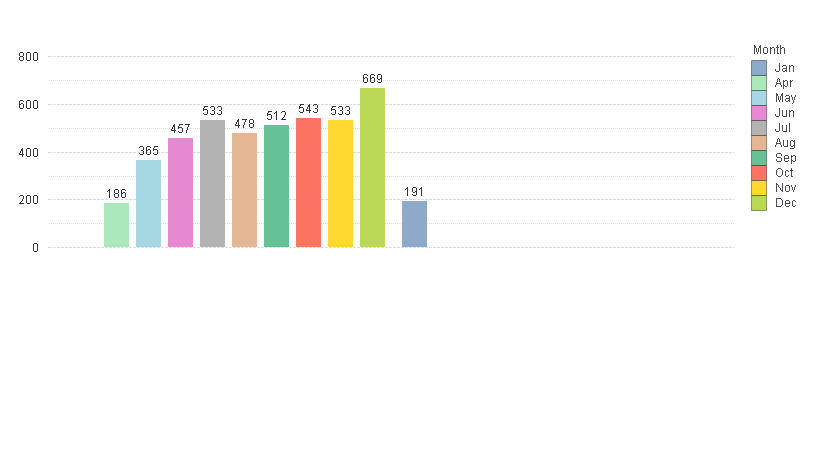
I have a chart like below

I want to show labels below e.g.
below 186 as Apr
365 as May.
How to achieve this?
Regards
Sandeep
304 Views
2 Replies
Master III
2016-01-22
09:38 AM
- Mark as New
- Bookmark
- Subscribe
- Mute
- Subscribe to RSS Feed
- Permalink
- Report Inappropriate Content
Do you want like this?
Just Put the Expression.. Like
=Dual(Month&chr(10)&sum(Sales),Sum(Sales))
Just a suggestion, Instead of above, you can simply enable 'Show Legend' in the Dimensions Tab.
Not applicable
2016-01-23
11:04 PM
Author
- Mark as New
- Bookmark
- Subscribe
- Mute
- Subscribe to RSS Feed
- Permalink
- Report Inappropriate Content
Thanks ..that helped.
229 Views