Unlock a world of possibilities! Login now and discover the exclusive benefits awaiting you.
- Qlik Community
- :
- All Forums
- :
- QlikView App Dev
- :
- Bar chart piled based in date range filter and pre...
- Subscribe to RSS Feed
- Mark Topic as New
- Mark Topic as Read
- Float this Topic for Current User
- Bookmark
- Subscribe
- Mute
- Printer Friendly Page
- Mark as New
- Bookmark
- Subscribe
- Mute
- Subscribe to RSS Feed
- Permalink
- Report Inappropriate Content
Bar chart piled based in date range filter and previous years
Hi everyone,
I'm trying to get this one and can't think of a way. After several days trying I'm finally asking for advise here.
What I'm trying to acomplish is as followed:
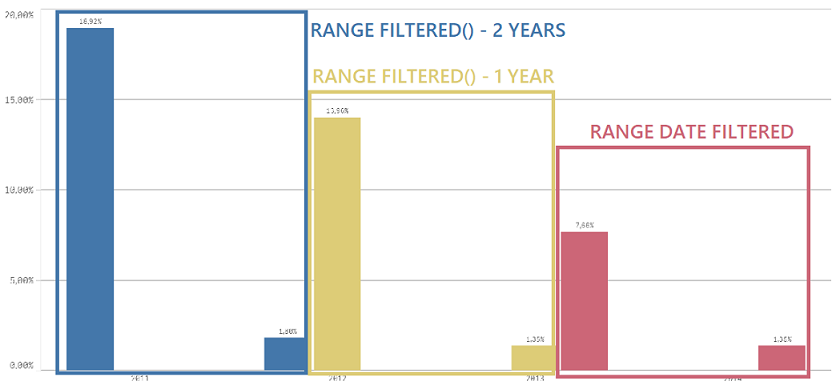
Once user Filters a date range (i.e: 01/04/2013 - 01/04/2014)
Getting values for the filtered dates: date={">=$(=DATE(Min(fec)))<=$(=DATE(Max(fec)))"}
Same period for the previous year: date={">=$(=DATE(AddYears(Min(fec),-1)))<=$(=DATE(AddYears(Max(fec),-1)))"}
As well as for same period two years prior: date={">=$(=DATE(AddYears(Min(fec),-2)))<=$(=DATE(AddYears(Max(fec),-2)))"}
Using as dimension: year(date)
I get as followed, what I would like to achieve is piled for each of 3 ranges

Thanks in advance to anyone that can shed some light here!!!