Unlock a world of possibilities! Login now and discover the exclusive benefits awaiting you.
- Qlik Community
- :
- All Forums
- :
- QlikView App Dev
- :
- Re: Re: Bar in Straight Table or in Pivot Table
- Subscribe to RSS Feed
- Mark Topic as New
- Mark Topic as Read
- Float this Topic for Current User
- Bookmark
- Subscribe
- Mute
- Printer Friendly Page
- Mark as New
- Bookmark
- Subscribe
- Mute
- Subscribe to RSS Feed
- Permalink
- Report Inappropriate Content
Bar in Straight Table or in Pivot Table
Hi All,
How to create Bars in Straight Table or in Pivot Table.
PFA image for Example.
can anyone help me.
Regards,
Rathnam.
- Mark as New
- Bookmark
- Subscribe
- Mute
- Subscribe to RSS Feed
- Permalink
- Report Inappropriate Content
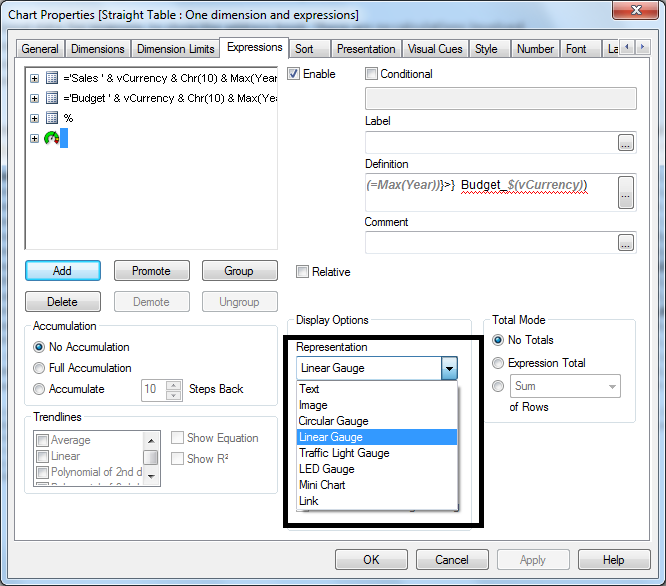
Use mini chart function for this in charts
Convert your expression into Linear Guage
See the attached snap shot

- Mark as New
- Bookmark
- Subscribe
- Mute
- Subscribe to RSS Feed
- Permalink
- Report Inappropriate Content
Hi,
Please find attached file for solution.
Regards,
Jagan.
- Mark as New
- Bookmark
- Subscribe
- Mute
- Subscribe to RSS Feed
- Permalink
- Report Inappropriate Content
Hi Jagan Mohan,
Thanks For ur reply.
Is it possible to plot values on Data points in this chart (as we do in Bar chart).
Regards,
Rathnam.
- Mark as New
- Bookmark
- Subscribe
- Mute
- Subscribe to RSS Feed
- Permalink
- Report Inappropriate Content
Hi,
You can create one more expression, pfa file for solution. There is no direct solution, it is not possible like regular bar chart.
Regards,
Jagan.
- Mark as New
- Bookmark
- Subscribe
- Mute
- Subscribe to RSS Feed
- Permalink
- Report Inappropriate Content
For any expression you can create many charts but use it different ways
like
Exp1:- Sum(SalesValue) value on data points
Exp2:- Sum(SalesValue) use as minichart
Exp3:- Sum(SalesValue) use ase Circular guage
Exp4:- Sum(SalesValue) use as Linear Guage
Exp5:- Sum(SalesValue) use as LED guage
- Mark as New
- Bookmark
- Subscribe
- Mute
- Subscribe to RSS Feed
- Permalink
- Report Inappropriate Content
Anand,
you may also try with "Trellis" Bar Chart (you may turn it on on Dimension Tab). Unfortunetely i don;t think that it will be possible to have only one Dimension values list.
Maybe there is something more in Qlik.Next????
regards
Darek