Unlock a world of possibilities! Login now and discover the exclusive benefits awaiting you.
- Qlik Community
- :
- All Forums
- :
- QlikView App Dev
- :
- Box plot - Allocated memory exceeded error
- Subscribe to RSS Feed
- Mark Topic as New
- Mark Topic as Read
- Float this Topic for Current User
- Bookmark
- Subscribe
- Mute
- Printer Friendly Page
- Mark as New
- Bookmark
- Subscribe
- Mute
- Subscribe to RSS Feed
- Permalink
- Report Inappropriate Content
Box plot - Allocated memory exceeded error
Hi Team,
I'm trying to build a Box plot based on the months dimension and expressions that is calculated. However the box plot seems to run in to error with "Allocated memory exceeded". I've used below sub expressions in the Box plot. Is there anything I can do to get this to work?
Sub-Expression | Formula |
Box Plot Top | =Fractile((Sum (ELIGIBLE_SUM - REPEAT_7_SUM) / sum(ELIGIBLE_SUM)),0.75) |
Box Plot Bottom | =Fractile((Sum (ELIGIBLE_SUM - REPEAT_7_SUM) / sum(ELIGIBLE_SUM)),0.25) |
Box Plot Middle | =Fractile((Sum (ELIGIBLE_SUM - REPEAT_7_SUM) / sum(ELIGIBLE_SUM)),0.50) |
Box Plot Upper Whisker | =Fractile((Sum (ELIGIBLE_SUM - REPEAT_7_SUM) / sum(ELIGIBLE_SUM)),0.95) |
Box Plot Lower Whisker | ==Fractile((Sum (ELIGIBLE_SUM - REPEAT_7_SUM) / sum(ELIGIBLE_SUM)),0.05) |
|
Two additional expressions. Both having display options as symbol ticked.
Max = Max(Sum (ELIGIBLE_SUM - REPEAT_7_SUM) / sum(ELIGIBLE_SUM))
Min = Min(Sum (ELIGIBLE_SUM - REPEAT_7_SUM) / sum(ELIGIBLE_SUM))
- Tags:
- box plot
- Mark as New
- Bookmark
- Subscribe
- Mute
- Subscribe to RSS Feed
- Permalink
- Report Inappropriate Content
You cannot have an aggregation function inside an other aggregation function, like you do in
Fractile(Sum(...))
To do this, you need an Aggr() between the two.
See more on Recipe for a Box Plot
HIC
- Mark as New
- Bookmark
- Subscribe
- Mute
- Subscribe to RSS Feed
- Permalink
- Report Inappropriate Content
Hi HIC,
Can you possibly elaborate the solution a bit further. As for me I'm attempting to express values by Months. Hence the value FCR% is calculated as below.
(Sum (ELIGIBLE_SUM - REPEAT_7_SUM) / sum(ELIGIBLE_SUM))
After reading up was thinking of replacing above with below. Pls advice.
Aggr(Sum (ELIGIBLE_SUM - REPEAT_7_SUM) / sum(ELIGIBLE_SUM),Months)
- Mark as New
- Bookmark
- Subscribe
- Mute
- Subscribe to RSS Feed
- Permalink
- Report Inappropriate Content
What is/are your chart dimension/s? The expressions will be of the form:
=Fractile(Aggr(Sum(ELIGIBLE_SUM - REPEAT_7_SUM) / sum(ELIGIBLE_SUM), <dim1>, <dim2>, ....),0.75)
Where <dim1>, <dim2>, .... is a comma separated list of the dimensions in your chart, and may include extra dimensions if your analysis requires them.
- Mark as New
- Bookmark
- Subscribe
- Mute
- Subscribe to RSS Feed
- Permalink
- Report Inappropriate Content
hi
check this document :
Creating a Candle light Chart or Box Plot Chart with custom Pop up of Plot values
- Mark as New
- Bookmark
- Subscribe
- Mute
- Subscribe to RSS Feed
- Permalink
- Report Inappropriate Content
I don't think you should use Months as grouping field in the Aggr(). But you haven't given me any information about what you want instead...
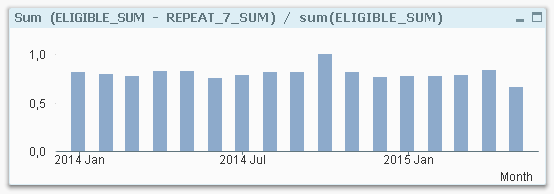
In the picture below, you have the wanted measure per month:

Now, you want to add an internal iterator within each month: You want to (within each month) show the median (and quartiles, etc.) per something, but you haven't told me per what. Per AGENT_AGS perhaps? Or per CENTRE_NAME? This is the field that you should use as grouping field in the Aggr().
If you want to the individual rows as the grouping symbol, everything becomes a lot simpler. Then you can define your metric
1-REPEAT_7_SUM/ELIGIBLE_SUM as Val,
already in the script and basically follow the instructions of the blog post.
HIC