Unlock a world of possibilities! Login now and discover the exclusive benefits awaiting you.
- Qlik Community
- :
- All Forums
- :
- QlikView App Dev
- :
- Re: Button that show and hide expression values un...
- Subscribe to RSS Feed
- Mark Topic as New
- Mark Topic as Read
- Float this Topic for Current User
- Bookmark
- Subscribe
- Mute
- Printer Friendly Page
- Mark as New
- Bookmark
- Subscribe
- Mute
- Subscribe to RSS Feed
- Permalink
- Report Inappropriate Content
Button that show and hide expression values under 100%
Hello.
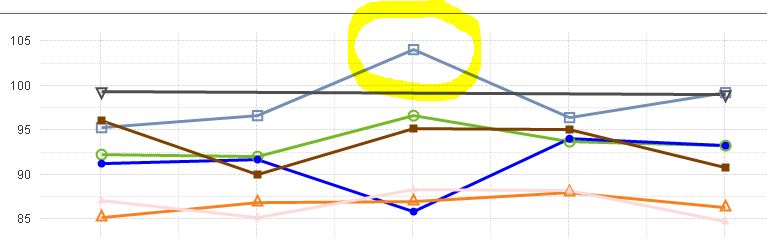
I have line chart where is values under and over 100%. How I can make button that show only values under 100%?
BR.
Timo
- Mark as New
- Bookmark
- Subscribe
- Mute
- Subscribe to RSS Feed
- Permalink
- Report Inappropriate Content
Could you share a sample qvw to work on?
- Mark as New
- Bookmark
- Subscribe
- Mute
- Subscribe to RSS Feed
- Permalink
- Report Inappropriate Content
hide/ you mean the data point? or the whole series?
- Mark as New
- Bookmark
- Subscribe
- Mute
- Subscribe to RSS Feed
- Permalink
- Report Inappropriate Content
Sorry about bad description. I need to make button or some kind of switch that filtering values in the whole series. So if the value is over 100% it will be ingnored. I also that same button do that vice versa so users can filtering those values out of the chart and also show those values if they want. I did variable but that either show chart or hide whole chart.
=if(vSelectExcluded = 0, 1, 0)
Hope that is better description.
-Timo-
- Mark as New
- Bookmark
- Subscribe
- Mute
- Subscribe to RSS Feed
- Permalink
- Report Inappropriate Content
You can make it this?
If(Variable=1 and Sum(Measure)<'100%', Sum(Measure))
OR
If(Variable=1 and Sum(Measure)/Sum(TOTAL <FIELDNAME> Measure)<'100%', Sum(Measure)/Sum(TOTAL <FIELDNAME> Measure))
Note - Instead of 100% you can use your own static number which returns in Percentage
- Mark as New
- Bookmark
- Subscribe
- Mute
- Subscribe to RSS Feed
- Permalink
- Report Inappropriate Content
Please see sample
Hope this will give you idea