Unlock a world of possibilities! Login now and discover the exclusive benefits awaiting you.
- Qlik Community
- :
- All Forums
- :
- QlikView App Dev
- :
- Calculated dimension
- Subscribe to RSS Feed
- Mark Topic as New
- Mark Topic as Read
- Float this Topic for Current User
- Bookmark
- Subscribe
- Mute
- Printer Friendly Page
- Mark as New
- Bookmark
- Subscribe
- Mute
- Subscribe to RSS Feed
- Permalink
- Report Inappropriate Content
Calculated dimension
Hello All,
i have to implement one requirement like when one of the dimension value is selected from filter then the chart should show values expression values according to that selection and the remaining data should be represented as 'Others' for rest of the values of the dimension.
Can anybody help regarding this issue. It will be great help.
- Mark as New
- Bookmark
- Subscribe
- Mute
- Subscribe to RSS Feed
- Permalink
- Report Inappropriate Content
Hey there,
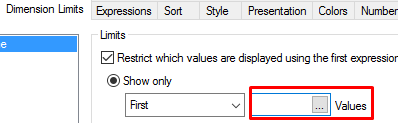
You make by going to Dimension Limits and in Values add this expression:
=GetSelectedCount(FieldName)
Show me what you've got 
Regards,
MB
- Mark as New
- Bookmark
- Subscribe
- Mute
- Subscribe to RSS Feed
- Permalink
- Report Inappropriate Content
Hello Miguel,
Thanks for your response. Actually i am using a pivot chart where dimension limit is no option.
And my requirement is like if there is dimension like name and values as 'A', 'B', 'C' ...
Then if i select A from filter then the chart should show values for A and rest for all values it should show as others as the dimension value.
Please revert if you are getting me or not.
- Mark as New
- Bookmark
- Subscribe
- Mute
- Subscribe to RSS Feed
- Permalink
- Report Inappropriate Content
May be you can use an approach similar to what has been specified here:
Re: Can I add an additional row to a Straigh Table to display a subtotal value?