Unlock a world of possibilities! Login now and discover the exclusive benefits awaiting you.
- Qlik Community
- :
- All Forums
- :
- QlikView App Dev
- :
- Can a bubble chart or scatter chart have dual axis...
- Subscribe to RSS Feed
- Mark Topic as New
- Mark Topic as Read
- Float this Topic for Current User
- Bookmark
- Subscribe
- Mute
- Printer Friendly Page
- Mark as New
- Bookmark
- Subscribe
- Mute
- Subscribe to RSS Feed
- Permalink
- Report Inappropriate Content
Can a bubble chart or scatter chart have dual axis?
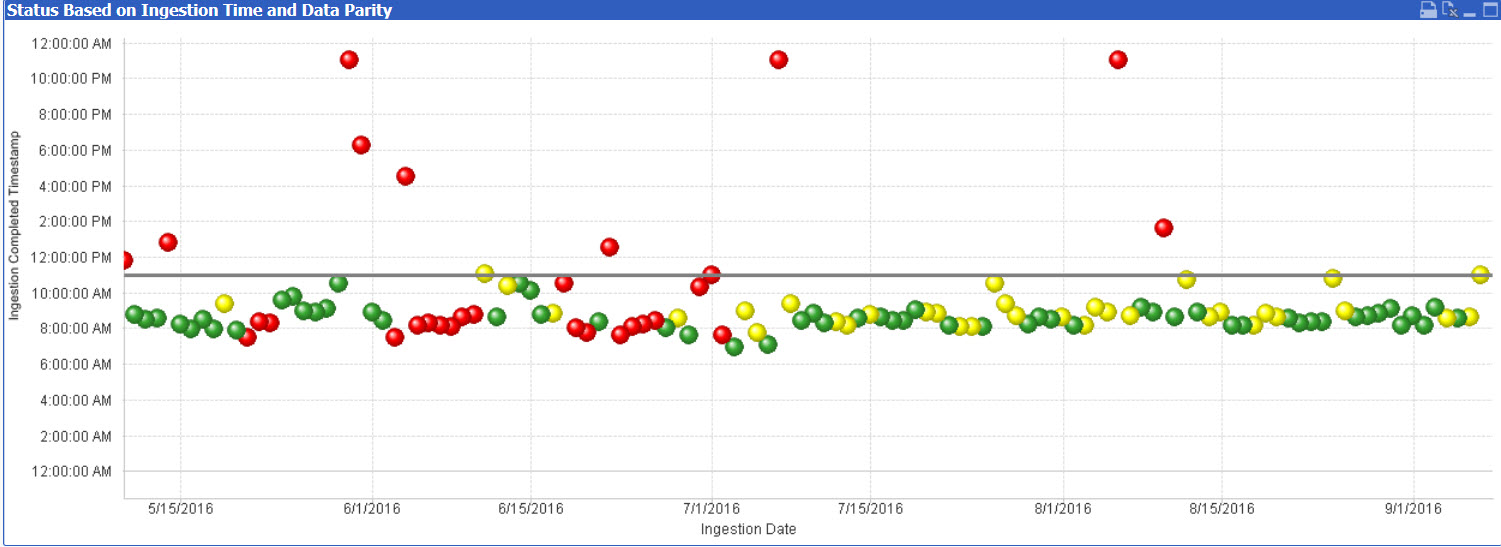
I have a requirement to show dual y axis on a scatter chart is that something possible ? basically I am going to get a new dimension into the existing chart showing the count of tables ingested on right - Y axis on based on x axis timeline

- Mark as New
- Bookmark
- Subscribe
- Mute
- Subscribe to RSS Feed
- Permalink
- Report Inappropriate Content
Can some one respond on this please?
- Mark as New
- Bookmark
- Subscribe
- Mute
- Subscribe to RSS Feed
- Permalink
- Report Inappropriate Content
I am not sure i doubt if we have any option to show that way. You can have dual axis like in a bar chart or a line chart. Just adding another expression and showing it text on axis for this second expression in expression tab.
- Mark as New
- Bookmark
- Subscribe
- Mute
- Subscribe to RSS Feed
- Permalink
- Report Inappropriate Content
please post an example app of what you currently have and describe how the bubble groups should be distributed and distinguished.
thanks
regards
Marco
- Mark as New
- Bookmark
- Subscribe
- Mute
- Subscribe to RSS Feed
- Permalink
- Report Inappropriate Content
Attached is my application , I want to include Count on the right Y - axis,a line showing the count as per the x - axis date range