Unlock a world of possibilities! Login now and discover the exclusive benefits awaiting you.
- Qlik Community
- :
- All Forums
- :
- QlikView App Dev
- :
- Can we use 2 scales in one chart
- Subscribe to RSS Feed
- Mark Topic as New
- Mark Topic as Read
- Float this Topic for Current User
- Bookmark
- Subscribe
- Mute
- Printer Friendly Page
- Mark as New
- Bookmark
- Subscribe
- Mute
- Subscribe to RSS Feed
- Permalink
- Report Inappropriate Content
Can we use 2 scales in one chart
Hi Everyone,
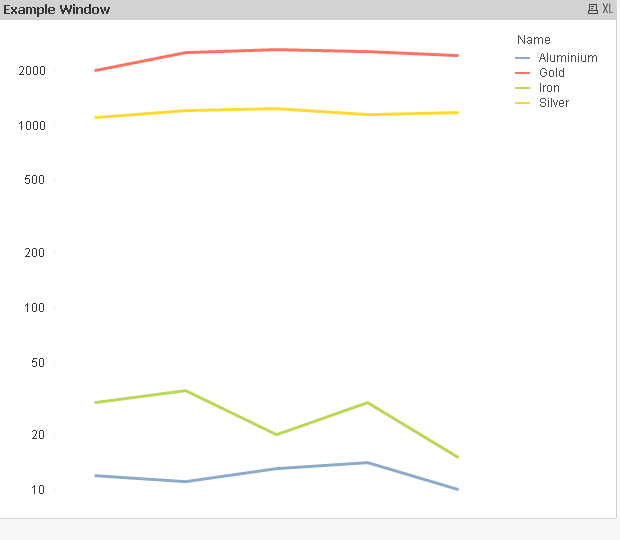
I have a requirement where I have to plot some large values along with some small values.There is a big difference in values and because of this the smaller ones are not visible properly.
Is there any way to display both, large and small values, on the same chart and both are visible?
Or is there any way to use 2 separate scales for larger and smaller values.
Please find the attached file to understand the situation.
Thanks
Accepted Solutions
- Mark as New
- Bookmark
- Subscribe
- Mute
- Subscribe to RSS Feed
- Permalink
- Report Inappropriate Content
- Mark as New
- Bookmark
- Subscribe
- Mute
- Subscribe to RSS Feed
- Permalink
- Report Inappropriate Content
when you define your second expression, on the axis tab you can select right9top) position for that expression. That will then give one scale on the left and another scale on the right - sepreate scales for each expression
- Mark as New
- Bookmark
- Subscribe
- Mute
- Subscribe to RSS Feed
- Permalink
- Report Inappropriate Content
did you try with a log scale (Axes tab)?
- Mark as New
- Bookmark
- Subscribe
- Mute
- Subscribe to RSS Feed
- Permalink
- Report Inappropriate Content
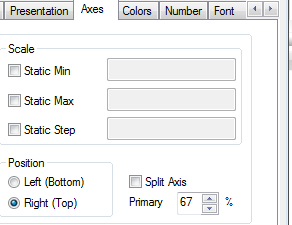
On the axes tab, when you have more than one expression, you can specify which axis the expression will use. This is how you can have 2 objects show on a chart when the scales are drastically different
- Mark as New
- Bookmark
- Subscribe
- Mute
- Subscribe to RSS Feed
- Permalink
- Report Inappropriate Content
You can use the options mentioned above to separate two expressions to top and bottom of the chart. Depending on the use (and i generally use this) i would put two line charts on, then choose to Split the Axis using the check box to the right of Adam's Position screenshot. This will plot the lines/bars on the same portions of the chart but each one would correspond to a left/right axis. I also generally color the axis text to resemble the bar/line color that corresponds to it.
- Mark as New
- Bookmark
- Subscribe
- Mute
- Subscribe to RSS Feed
- Permalink
- Report Inappropriate Content
Thanks everyone for providing the input. The way suggested by maxgro suits my requirement. Answer from Adam helpful in creating different scales in one chart.