Unlock a world of possibilities! Login now and discover the exclusive benefits awaiting you.
- Qlik Community
- :
- All Forums
- :
- QlikView App Dev
- :
- Re: Changing default colors in Charts
- Subscribe to RSS Feed
- Mark Topic as New
- Mark Topic as Read
- Float this Topic for Current User
- Bookmark
- Subscribe
- Mute
- Printer Friendly Page
- Mark as New
- Bookmark
- Subscribe
- Mute
- Subscribe to RSS Feed
- Permalink
- Report Inappropriate Content
Changing default colors in Charts
Hello Guys!
I have a Mekko Chart, two dimensions...the problem is i want to change the colors to be more meaningful.
My dimensions are Province and Status.
Possible Values of Status are (Bad, Normal, Good). I want to set Green for Good, Red for Bad and Yellow for Normal
How can i set colors manually?
thanks a lot
Accepted Solutions
- Mark as New
- Bookmark
- Subscribe
- Mute
- Subscribe to RSS Feed
- Permalink
- Report Inappropriate Content
Yes, you go to expresion and click in the + simbol, and select "Text Color" or another attribute, and put the expression you want.

- Mark as New
- Bookmark
- Subscribe
- Mute
- Subscribe to RSS Feed
- Permalink
- Report Inappropriate Content
Hi Arman,
Right click on chart , go to properties -> colors tab -> Data Appearance
colors 1-6 -> here we can change colors
Regards,
Janardhan
- Mark as New
- Bookmark
- Subscribe
- Mute
- Subscribe to RSS Feed
- Permalink
- Report Inappropriate Content
You can see this ...
http://community.qlik.com/blogs/qlikviewdesignblog/2012/12/04/colors-in-charts
- Mark as New
- Bookmark
- Subscribe
- Mute
- Subscribe to RSS Feed
- Permalink
- Report Inappropriate Content
I've already red that topic, I don't want to change the background color. I want to change the color of mekko chart part, as i mentioned in the question. would you please explain to me how to change the preset color of chart and set it manually?
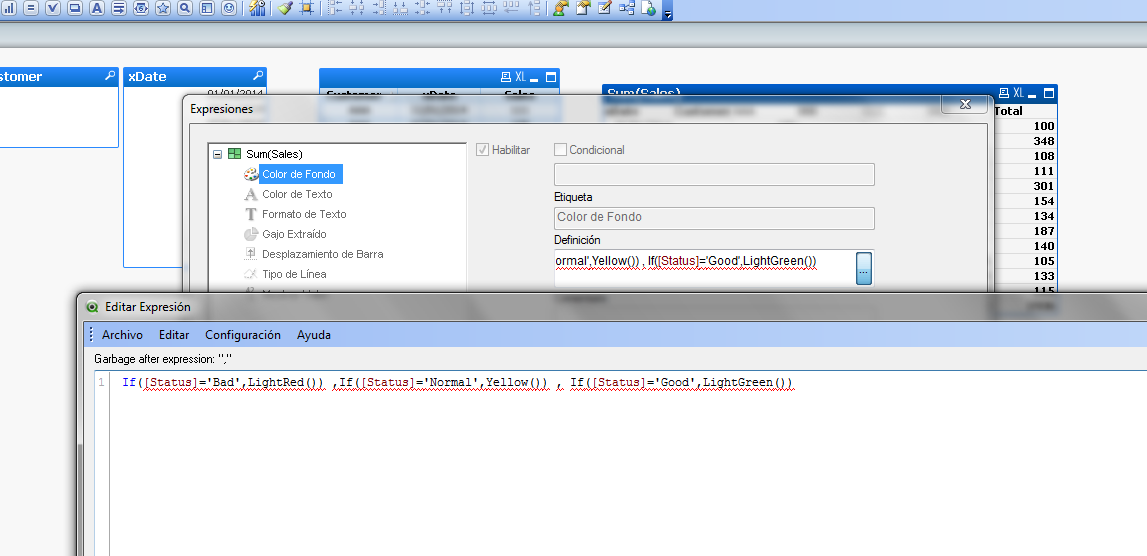
Something like this i guess : If([Status]='Bad',LightRed()) ,If([Status]='Normal',Yellow()) , If([Status]='Good',LightGreen())
- Mark as New
- Bookmark
- Subscribe
- Mute
- Subscribe to RSS Feed
- Permalink
- Report Inappropriate Content
Yes, you go to expresion and click in the + simbol, and select "Text Color" or another attribute, and put the expression you want.

- Mark as New
- Bookmark
- Subscribe
- Mute
- Subscribe to RSS Feed
- Permalink
- Report Inappropriate Content
In your expression you some errors:
If([Status]='Bad',LightRed() ,If([Status]='Normal',Yellow() , If([Status]='Good',LightGreen())))
- Mark as New
- Bookmark
- Subscribe
- Mute
- Subscribe to RSS Feed
- Permalink
- Report Inappropriate Content
Dear,
Kindly find the attached file.
i hope it will help u.
Thanks,
Mukram.
!
- Mark as New
- Bookmark
- Subscribe
- Mute
- Subscribe to RSS Feed
- Permalink
- Report Inappropriate Content
This is my proposal ¿¿??