Unlock a world of possibilities! Login now and discover the exclusive benefits awaiting you.
- Qlik Community
- :
- All Forums
- :
- QlikView App Dev
- :
- Chart axes changes from 100% to 1.0 on selection
- Subscribe to RSS Feed
- Mark Topic as New
- Mark Topic as Read
- Float this Topic for Current User
- Bookmark
- Subscribe
- Mute
- Printer Friendly Page
- Mark as New
- Bookmark
- Subscribe
- Mute
- Subscribe to RSS Feed
- Permalink
- Report Inappropriate Content
Chart axes changes from 100% to 1.0 on selection
Hi All,
I tried to create a mock QVW but couldn't replicate what I have in my main QVW.
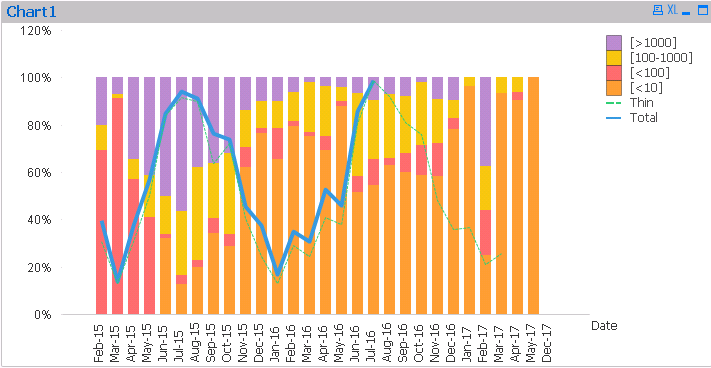
I have a combo chart bar/line with axes totalling 100% Overall it's fine and looks how it should. However when I click on a date which does not have a line value the axes changes from 100% to 1.0. Below is the chart without selections.

The bars are stacked to 100% which is perfect and the lines also show as a percentage.
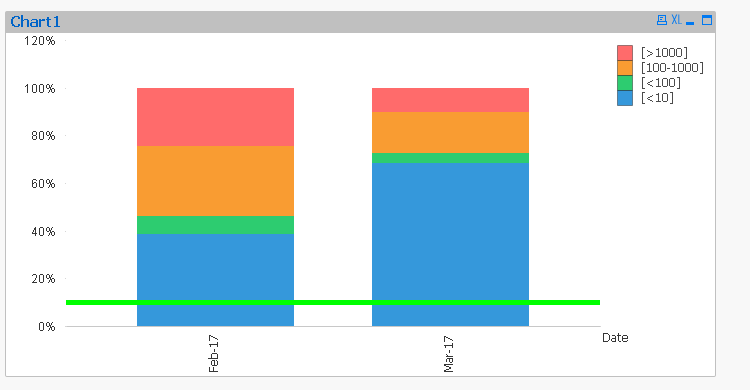
The problem occurs when I click on a date without a Total field value. For this example I click on dates Aug 16 and Sep 16.

You'll see the axes changes now to 1.0 instead of 100%.
Each bar expression looks like the following for it's respective field.
[<10]/(sum([<10])+sum([<100])+sum([100-1000])+sum([>1000]))
The "thin" and "total" expressions are just calling the field value which is between 0-1.
I have selected in the number tab "show in Percent (%)" .
Any ideas?
Thanks,
Tom
- « Previous Replies
-
- 1
- 2
- Next Replies »
Accepted Solutions
- Mark as New
- Bookmark
- Subscribe
- Mute
- Subscribe to RSS Feed
- Permalink
- Report Inappropriate Content
- Mark as New
- Bookmark
- Subscribe
- Mute
- Subscribe to RSS Feed
- Permalink
- Report Inappropriate Content
Hi Tom,
It will be difficult to help you without looking at the application.
If possible share your app.
Regards,
Kaushik Solanki
- Mark as New
- Bookmark
- Subscribe
- Mute
- Subscribe to RSS Feed
- Permalink
- Report Inappropriate Content
Here is a sample qvw.
- Mark as New
- Bookmark
- Subscribe
- Mute
- Subscribe to RSS Feed
- Permalink
- Report Inappropriate Content
Hi Tom,
I checked all possible selections and i cant see the axis changing to 1
Regards,
Kaushik Solanki
- Mark as New
- Bookmark
- Subscribe
- Mute
- Subscribe to RSS Feed
- Permalink
- Report Inappropriate Content
Hi Kaushik,
Select a date like shown below and it will change to 1.

Thanks,
Tom
- Mark as New
- Bookmark
- Subscribe
- Mute
- Subscribe to RSS Feed
- Permalink
- Report Inappropriate Content
Check this. The axis is still the same.
Regards,
Kaushik Solanki
- Mark as New
- Bookmark
- Subscribe
- Mute
- Subscribe to RSS Feed
- Permalink
- Report Inappropriate Content
Hi Tom,
this is behavior QV 11.20.
OK in 12.10.
Regards,
Antonio
- Mark as New
- Bookmark
- Subscribe
- Mute
- Subscribe to RSS Feed
- Permalink
- Report Inappropriate Content
Not for me ![]()
I'm using the same qvw as you.

- Mark as New
- Bookmark
- Subscribe
- Mute
- Subscribe to RSS Feed
- Permalink
- Report Inappropriate Content
What version you are using?
Regards,
Kaushik Solanki
- Mark as New
- Bookmark
- Subscribe
- Mute
- Subscribe to RSS Feed
- Permalink
- Report Inappropriate Content
QV 12.10

QV 11.20

- « Previous Replies
-
- 1
- 2
- Next Replies »