- Mark as New
- Bookmark
- Subscribe
- Mute
- Subscribe to RSS Feed
- Permalink
- Report Inappropriate Content
Chart colour and popup labels
Hi
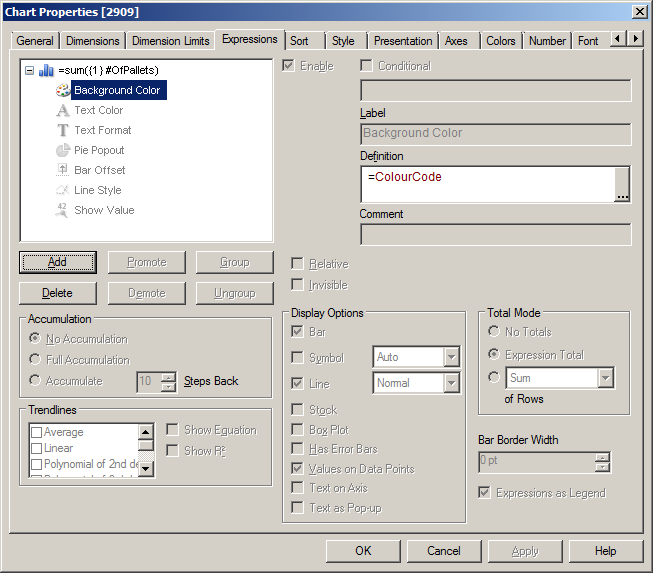
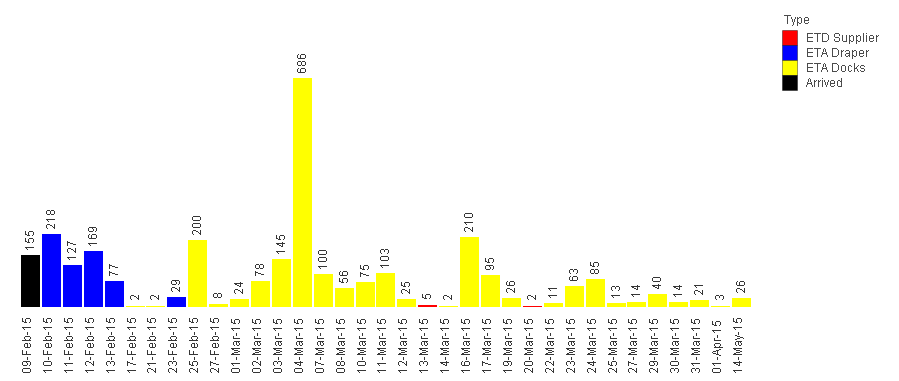
I have associated an RGB colour in the load script against my dimension and I have created a bar chart which is working correctly to display the bar colours associated to the dimensions.

I want this chart to ignore selections so I have added the {1} in the set analysis.
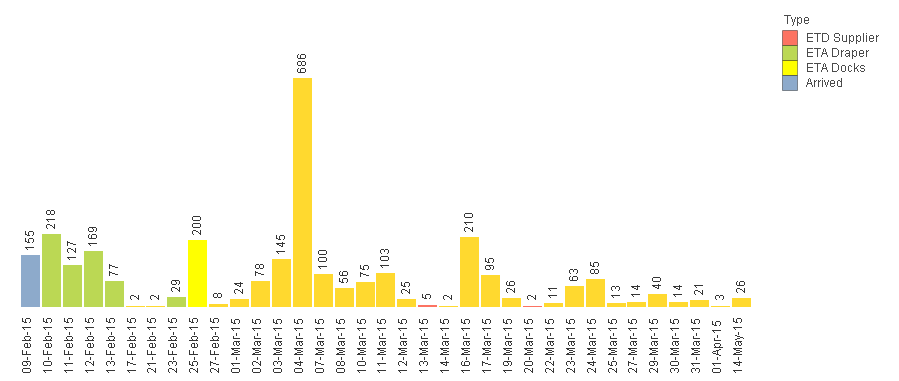
What is confusing me however is that the chart holds its values fine and ignores the selections but the colours change instead. Does anyone know how you prevent this?


Also, while I'm asking questions, I know there is a trick to showing custom popup labels in charts by creating another expression and turning off the default popups under the Presentation tab. For some reason I can not get this to work anymore. Has something changed or am I missing a step?
Thanks
Oli
Accepted Solutions
- Mark as New
- Bookmark
- Subscribe
- Mute
- Subscribe to RSS Feed
- Permalink
- Report Inappropriate Content
Just to close off this post, I solved the issue which was causing me problems for the chart custom colours. I had to tweak the expression in the background colour and I also had some unexpected values in the field that the custom colours were based on.
Particular thank you to greeshma_k regarding the pop-up label bug.
Oli
- Mark as New
- Bookmark
- Subscribe
- Mute
- Subscribe to RSS Feed
- Permalink
- Report Inappropriate Content
Hi,
Might be this will help you, create something similar in your script:
set vColorActDirectLabor = 'rgb(141,170,203)';
set vColorAOPDirectLabor = 'rgb(252,115,98)';
set vColorActIndirectLabor = 'rgb(187,216,84)';
set vColorAOPIndirectLabor = 'rgb(255,217,47)';
set vColorAct%DirectLaborofRevenue = 'rgb(102,194,150)';
set vColorAOP%DirectLaborofRevenue = 'rgb(229,182,148)';
And later call them inside background Color for your expressions.
Thanks,
AS
- Mark as New
- Bookmark
- Subscribe
- Mute
- Subscribe to RSS Feed
- Permalink
- Report Inappropriate Content
Try this: On the tab Colors select Persistent colors.
Help text:
"
| Persistent Colors | Checking this option locks the color map so that each value has a color permanently assigned to it. |
"
- Mark as New
- Bookmark
- Subscribe
- Mute
- Subscribe to RSS Feed
- Permalink
- Report Inappropriate Content
Hi
I may have spoken too soon when I said it was working.
What I am trying to achieve is a colourcoded stacked bar chart showing the amount of pallets due to arrive by date. I am trying to show thick bars with the total value of the stack above itself and prevent user selection changing the layout.
Currently (unfiltered) the colours look correct but when a date is selected the format of the chart resembles what I am trying to achieve but the colours change. I am also sure the bars are not stacking as I hoped they would.
I have attached my model so hopefully you will be able to show me where I am going wrong.
I tried to reply sooner but the website was faling me.
Just when I think I am getting the hang of QlikView it proves my wrong...
Many thanks
Oli
- Mark as New
- Bookmark
- Subscribe
- Mute
- Subscribe to RSS Feed
- Permalink
- Report Inappropriate Content
What version of Qlikview are you using? Pop up labels do not work as expected from QV11 SR 7 onwards. You can refer to the below thread
http://community.qlik.com/thread/127809
Regards,
Greeshma
- Mark as New
- Bookmark
- Subscribe
- Mute
- Subscribe to RSS Feed
- Permalink
- Report Inappropriate Content
Hi Greeshma
Version 11.2 SR9 - I must have missed that memo.
Thanks
Oli
- Mark as New
- Bookmark
- Subscribe
- Mute
- Subscribe to RSS Feed
- Permalink
- Report Inappropriate Content
Hi Michiel
Sadly that did not fix my problem. I think I have the chart working again properly by using set analysis to ignore all the date selections but the colours are not behaving even with persistent colours turned on.
Oli
- Mark as New
- Bookmark
- Subscribe
- Mute
- Subscribe to RSS Feed
- Permalink
- Report Inappropriate Content
Just to close off this post, I solved the issue which was causing me problems for the chart custom colours. I had to tweak the expression in the background colour and I also had some unexpected values in the field that the custom colours were based on.
Particular thank you to greeshma_k regarding the pop-up label bug.
Oli