Unlock a world of possibilities! Login now and discover the exclusive benefits awaiting you.
- Qlik Community
- :
- All Forums
- :
- QlikView App Dev
- :
- Chart: displaying values non-related to dimension
- Subscribe to RSS Feed
- Mark Topic as New
- Mark Topic as Read
- Float this Topic for Current User
- Bookmark
- Subscribe
- Mute
- Printer Friendly Page
- Mark as New
- Bookmark
- Subscribe
- Mute
- Subscribe to RSS Feed
- Permalink
- Report Inappropriate Content
Chart: displaying values non-related to dimension
Hi folks!
I have a bar chart which displays for each month of the current fiscal year 2012/13, which extends from april to march:
- sum(sales)
- forecast
My dimension is [unique fiscal month], so it starts with 2012-04, 2012-05, ...
What I wanna do is display sum(sales) of the preceding fiscal year 2011/12 in the same chart, as reference value. My problem is self explanatory: values, that belong to a unique fiscal month of the preceding year, cannot be displayed in the current year.
So my question is: can these values be kinda "moved" from it's unique fiscal month in the last year, to be displayed as comparative value in the actual year?
- Mark as New
- Bookmark
- Subscribe
- Mute
- Subscribe to RSS Feed
- Permalink
- Report Inappropriate Content
You can use a set analysis expression to do this. I assume unique fiscal month is a string, so you need some shenanigans to create get the fiscal month of the previous year.
vPrevMonth: num(left([unique fiscal month],4))-1 & right([unique fiscal month],3)
The set analysis expression would then be
Sum({<[unique fiscal month]={"$(vPrevMonth)"} > } sales )
talk is cheap, supply exceeds demand
- Mark as New
- Bookmark
- Subscribe
- Mute
- Subscribe to RSS Feed
- Permalink
- Report Inappropriate Content
My problem is not, to sum up the sales of the previous fiscal year, but to display them in the actual year.
- Mark as New
- Bookmark
- Subscribe
- Mute
- Subscribe to RSS Feed
- Permalink
- Report Inappropriate Content
I totally don't understand what you mean. So, I'm afraid your problem is not self explanatory. At least not to me. As far as I know a set analysis expression like I posted above would do what you want. Can you share the qvw you're working on?
talk is cheap, supply exceeds demand
- Mark as New
- Bookmark
- Subscribe
- Mute
- Subscribe to RSS Feed
- Permalink
- Report Inappropriate Content
I am very sorry that, due to my limited english, I'm not able to explain my problem in a better way. The problem itself really is quite simple.
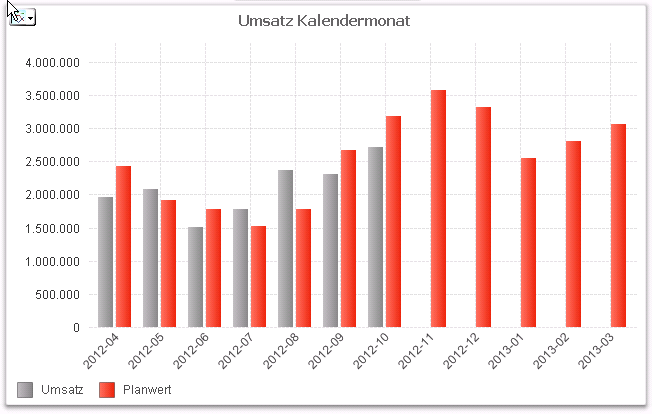
The actual state is as shown in the following screenshot:

You see the actual sum of all sales (Umsatz) and the planned sales forecast (Planwert), grouped by the unique fiscal months of the actual fiscal year.
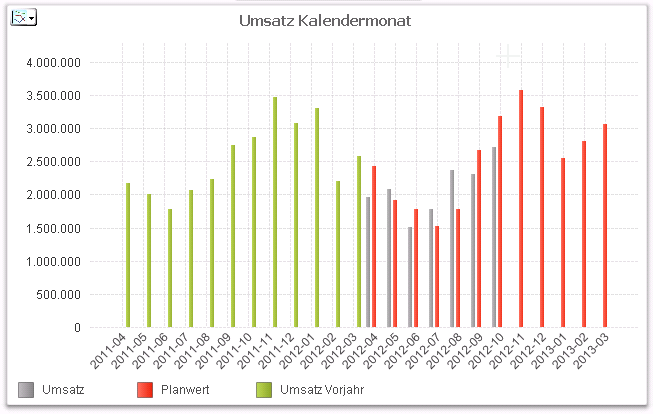
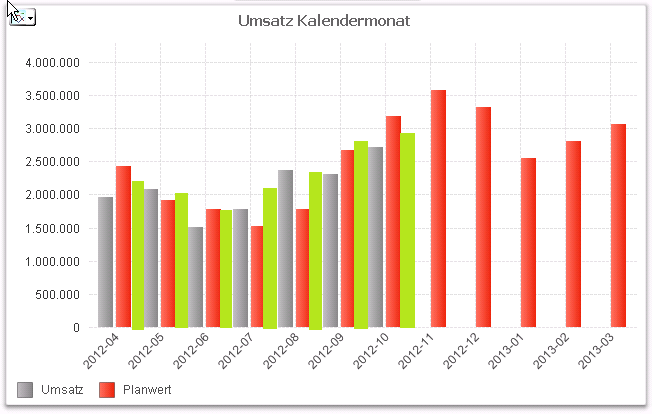
What I want is a 3rd bar, displaying the sales of the corresponding month one year before (let's say 2011-04) as comparative value for 2012-04.
No matter which way I calculate the numbers for 2011-04. Because these sales happened in 2011, the are also displayed in 2011:

What it finally should look like is:

- Mark as New
- Bookmark
- Subscribe
- Mute
- Subscribe to RSS Feed
- Permalink
- Report Inappropriate Content
Ok, I think you need a dimension fiscal month that does not contain the year and a dimension fiscal year. Then you can use that dimension to display the previous years sales along with this years. The dimension in your chart would be FiscalMonth, the expressions would be something like:
Planwert: sum(Planwert)
Umsatz selektiertes Jahr: sum(Umsatz)
Umsatz voriges Jahr: sum({<[FiscalYear]={$(=only([FiscalYear])-1)}>} Umsatz)
I've attached a simple example with something like you're asking for (if I understand correctly).
talk is cheap, supply exceeds demand