Unlock a world of possibilities! Login now and discover the exclusive benefits awaiting you.
- Qlik Community
- :
- All Forums
- :
- QlikView App Dev
- :
- Re: Chart functions to work as Excel
- Subscribe to RSS Feed
- Mark Topic as New
- Mark Topic as Read
- Float this Topic for Current User
- Bookmark
- Subscribe
- Mute
- Printer Friendly Page
- Mark as New
- Bookmark
- Subscribe
- Mute
- Subscribe to RSS Feed
- Permalink
- Report Inappropriate Content
Chart functions to work as Excel
My knowledge of the map features are limited even though I always work with the set of analysis and trying to optimize as much as I can in the script with flags.
But now I am trying to understand if I can use QlikView in the typical Excel strategy. Attached is an excel where I have 5 columns I try to recreate in QVW file. Everything is in a straight table and expressions must be nested.
- - - - - - -
Mina kunskaper i kartans funktioner är begränsad även om jag alltid arbetar med uppsättningen analys och försöker optimera så mycket som jag kan i skript med flaggor.
Men nu försöker jag förstå om jag kan använda Qlikview i den typiska Excel strategi. Bifogat är en excel där jag har 5 kolumner jag försöker återskapa i QVW filen. Allt är i en rak tabell och uttryck måste kapslas.
Note: Edited by Community Moderator to include English translation as a courtesy. Please use English in main forums.
Accepted Solutions
- Mark as New
- Bookmark
- Subscribe
- Mute
- Subscribe to RSS Feed
- Permalink
- Report Inappropriate Content
Is this what you are looking for?
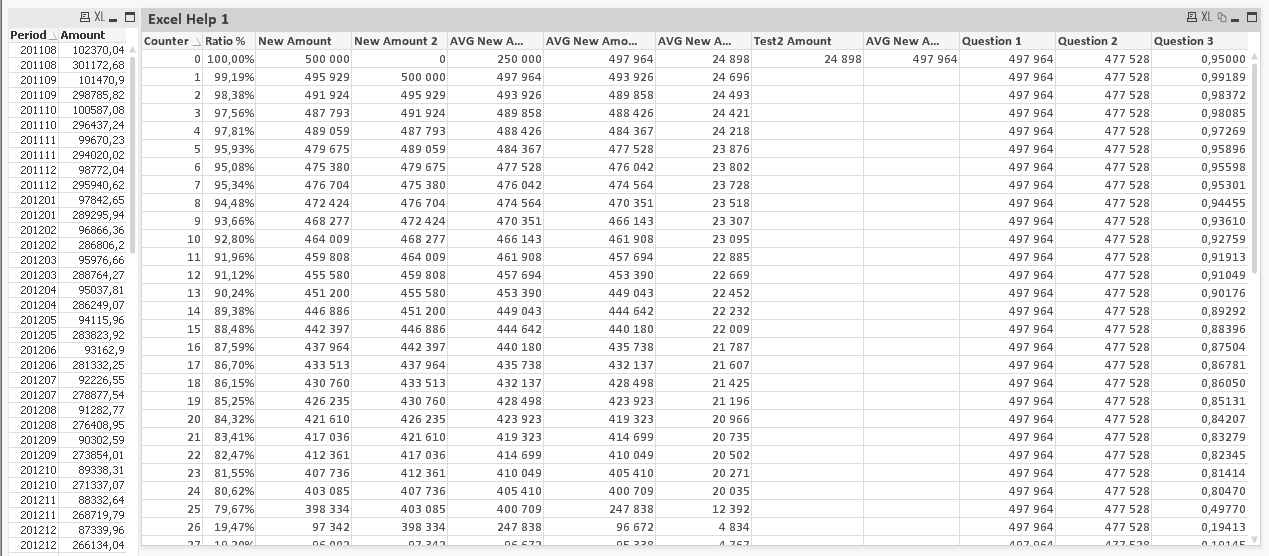
Expressions
Question 1
Only(TOTAL {<Counter = {0}>}Aggr(Below(RangeAvg(Alt(Above(Sum(Amount)/Sum({$<Counter = {'0'} >} Total Amount)), 0), Sum(Amount)/Sum({$<Counter = {'0'} >} Total Amount)) * vTest1), Counter))
Question 2
Only(TOTAL {<Counter = {5}>}Aggr(Below(RangeAvg(Alt(Above(Sum(Amount)/Sum({$<Counter = {'0'} >} Total Amount)), 0), Sum(Amount)/Sum({$<Counter = {'0'} >} Total Amount)) * vTest1), Counter))
Question 3
=RangeSum(Column(5), -Column(7))/Column(9)
- Mark as New
- Bookmark
- Subscribe
- Mute
- Subscribe to RSS Feed
- Permalink
- Report Inappropriate Content
May be this
- Mark as New
- Bookmark
- Subscribe
- Mute
- Subscribe to RSS Feed
- Permalink
- Report Inappropriate Content
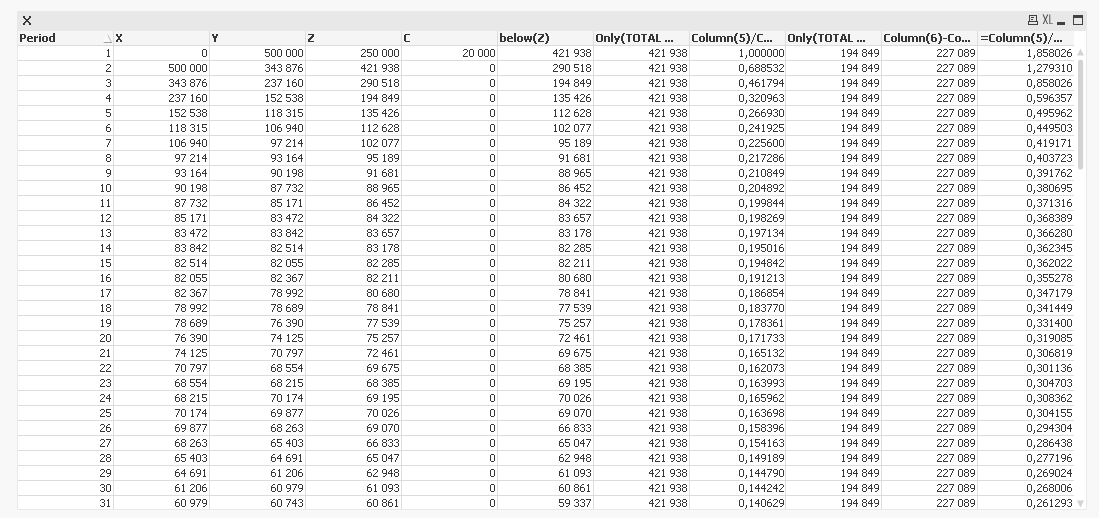
Thx Sunny that's exactly the logic I want the chart to display. When I'm trying to implement this in my model it seems like I have issues with Aggr function. I have now updated the dataset to display what I get, do you see what I need to adjust to make this work?
Chart_Help_2.qvw
Chart Result 2
Cheers,
Johan
- Mark as New
- Bookmark
- Subscribe
- Mute
- Subscribe to RSS Feed
- Permalink
- Report Inappropriate Content
Is this what you are looking for?
Expressions
Question 1
Only(TOTAL {<Counter = {0}>}Aggr(Below(RangeAvg(Alt(Above(Sum(Amount)/Sum({$<Counter = {'0'} >} Total Amount)), 0), Sum(Amount)/Sum({$<Counter = {'0'} >} Total Amount)) * vTest1), Counter))
Question 2
Only(TOTAL {<Counter = {5}>}Aggr(Below(RangeAvg(Alt(Above(Sum(Amount)/Sum({$<Counter = {'0'} >} Total Amount)), 0), Sum(Amount)/Sum({$<Counter = {'0'} >} Total Amount)) * vTest1), Counter))
Question 3
=RangeSum(Column(5), -Column(7))/Column(9)