Unlock a world of possibilities! Login now and discover the exclusive benefits awaiting you.
- Qlik Community
- :
- All Forums
- :
- QlikView App Dev
- :
- Chart including relative values evolution
- Subscribe to RSS Feed
- Mark Topic as New
- Mark Topic as Read
- Float this Topic for Current User
- Bookmark
- Subscribe
- Mute
- Printer Friendly Page
- Mark as New
- Bookmark
- Subscribe
- Mute
- Subscribe to RSS Feed
- Permalink
- Report Inappropriate Content
Chart including relative values evolution
Hi all,
I'm trying to get something like this:
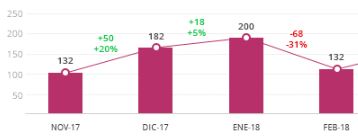
Let's say I have sales and months, and I want a line&bar chart with the sales in the bars and the difference between month-past mont in the line as can be seen in the image. I'm aware is very difficult to get the values halfway through 2 dimensions, that's not important, they can be shown as values from the line expression.
Other requirement I have is if I select 2 months, the line value should reflect the difference between those 2 months; and if I have only one month selected it will show 0 (no evolution in that month)
Attached is an example with some data for testing
Thanks a lot in advance!
Accepted Solutions
- Mark as New
- Bookmark
- Subscribe
- Mute
- Subscribe to RSS Feed
- Permalink
- Report Inappropriate Content
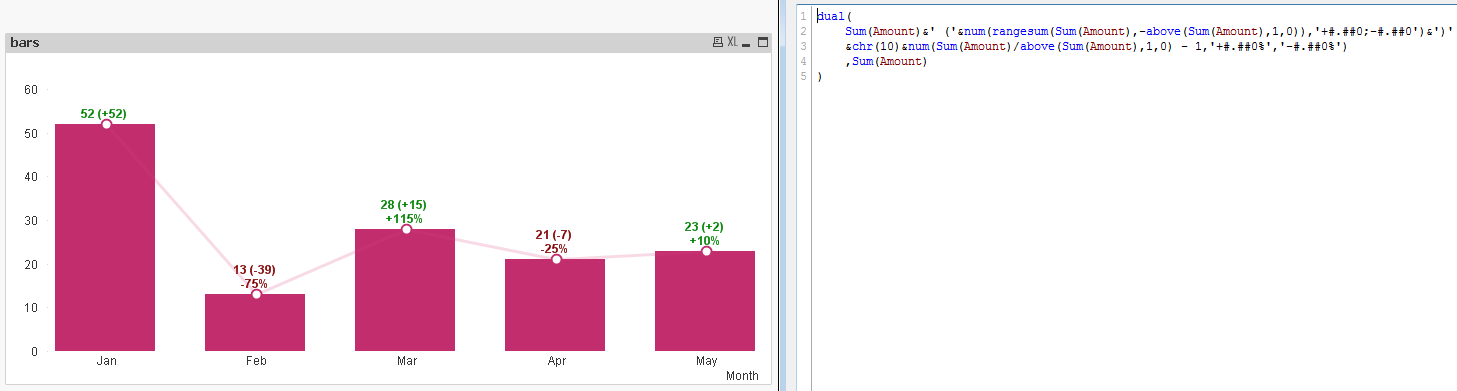
Hello!
Use Above() function and some cosmetical hints. You can find some at the attachement.
- Mark as New
- Bookmark
- Subscribe
- Mute
- Subscribe to RSS Feed
- Permalink
- Report Inappropriate Content
Hello!
Use Above() function and some cosmetical hints. You can find some at the attachement.
- Mark as New
- Bookmark
- Subscribe
- Mute
- Subscribe to RSS Feed
- Permalink
- Report Inappropriate Content
Thanks man!
Works nicely