Unlock a world of possibilities! Login now and discover the exclusive benefits awaiting you.
- Qlik Community
- :
- All Forums
- :
- QlikView App Dev
- :
- Re: Chart seems to show RangeAvg data by concurren...
- Subscribe to RSS Feed
- Mark Topic as New
- Mark Topic as Read
- Float this Topic for Current User
- Bookmark
- Subscribe
- Mute
- Printer Friendly Page
- Mark as New
- Bookmark
- Subscribe
- Mute
- Subscribe to RSS Feed
- Permalink
- Report Inappropriate Content
Chart seems to show RangeAvg data by concurrent years but showing Count and RangeAvg instead
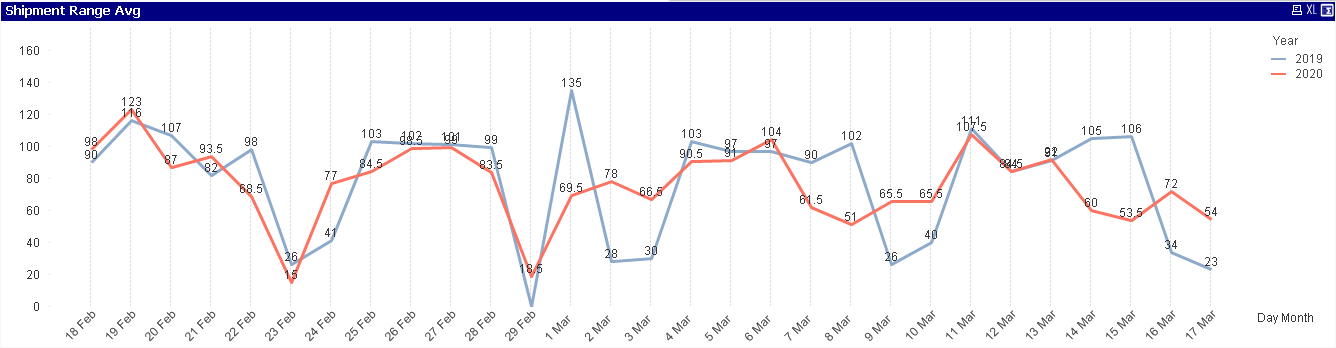
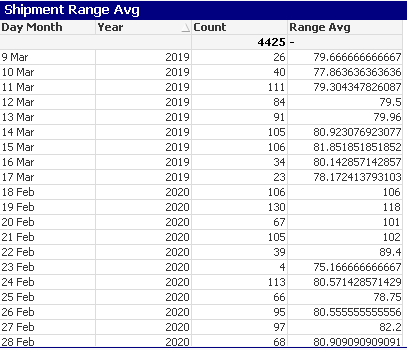
I have a chart with 2 dimensions, [Day Month] and [Year], and two expressions, [Count] and [Range Avg]. [Range Avg] uses the RangeAvg() function which operates on the [Count] expression. This is working fine. However, I am trying to use QlikView's functionality to display two line graphs on the same chart, and this is where things are going wrong. I want the chart to show a different line for Range Avg's in different years (2019 and 2020). When I take the table and Fast Change it to a chart, the chart looks like its showing the [Range Avg] field by year, but it seems to be getting confused and showing the [Count] data for 2019 and the [Range Avg] data for 2020! On top of that I cannot disable the [Count] field because then the [Range Avg] field has no data source and the chart has no data.If you compare the attached table chart vs. line chart, you will see the blue line for 2019 on the line chart is showing the [Count] column data for 2019, when it should be showing the [Range Avg] data for 2019. The Red 2020 line is showing the correct 2020 [Range Avg] data.
I have already tried unticking all Display Options for the [Count] field in the Expressions tab. Is there any way to massage the chart settings to get it to give me what I want?
Thanks
Jason
Accepted Solutions
- Mark as New
- Bookmark
- Subscribe
- Mute
- Subscribe to RSS Feed
- Permalink
- Report Inappropriate Content
I managed to figure it out. Here is the expression if anyone is interested. It appears I needed to place the [year] column above the [Day Month] column, instead of below:
=
Aggr (
RangeAvg (
Above (
Aggr (
count(JS_UniqueConsignRef),
[year],
[Day Month]
),
0,
RowNo()
)
),
[year],
[Day Month]
)
- Mark as New
- Bookmark
- Subscribe
- Mute
- Subscribe to RSS Feed
- Permalink
- Report Inappropriate Content
Try this
Aggr(
   YourExpression
, Year, [Day Month])
Replace YourExpression with your actual expressions
- Mark as New
- Bookmark
- Subscribe
- Mute
- Subscribe to RSS Feed
- Permalink
- Report Inappropriate Content
I am not sure how I would use my expression in the Aggr() function. My 1st expression, called "Count" is "count(distinct JS_UniqueConsignRef)" and the expression that I am trying to get on the chart (for the two different years) is "RangeAvg (Above(Count,0,RowNo()))". But the second expression is dependent on the first one because the second expression uses RowNo() from the Count column, and so the Count column has to exist in the chart for the RangeAvg() expression to work. Could I use the Aggr() function to work out RangeAvg without having to depend on the Count column, so that I can remove it? Can you provide a clearer example?
Many thanks,
Jason
- Mark as New
- Bookmark
- Subscribe
- Mute
- Subscribe to RSS Feed
- Permalink
- Report Inappropriate Content
I have tried using Aggr() and RangeAvg() in the same expression:
=
Aggr (
RangeAvg (
Above (
Aggr (
count(JS_UniqueConsignRef),
[Day Month]
),
0,
RowNo()
)
),
[Day Month]
)
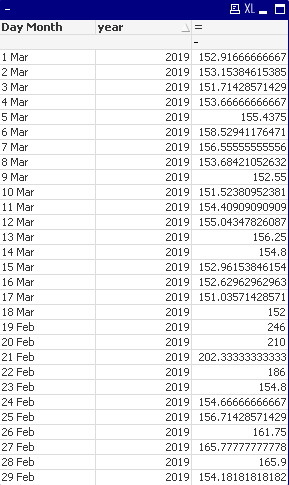
This calculates the RangeAvg correctly but ignores the year (see attachment) so each [Day Month] has twice the RangeAvg it should have. However, when I try to add [year] beneath each [Day Month] in the above expression, so that the Aggr functions are dimensioned by both [year] and [Day Month], the expression returns '-' for all rows. I need the Aggr functions to be dimensioned by both.
- Mark as New
- Bookmark
- Subscribe
- Mute
- Subscribe to RSS Feed
- Permalink
- Report Inappropriate Content
I managed to figure it out. Here is the expression if anyone is interested. It appears I needed to place the [year] column above the [Day Month] column, instead of below:
=
Aggr (
RangeAvg (
Above (
Aggr (
count(JS_UniqueConsignRef),
[year],
[Day Month]
),
0,
RowNo()
)
),
[year],
[Day Month]
)