Unlock a world of possibilities! Login now and discover the exclusive benefits awaiting you.
- Qlik Community
- :
- All Forums
- :
- QlikView App Dev
- :
- Chart shows values for 2 dates
- Subscribe to RSS Feed
- Mark Topic as New
- Mark Topic as Read
- Float this Topic for Current User
- Bookmark
- Subscribe
- Mute
- Printer Friendly Page
- Mark as New
- Bookmark
- Subscribe
- Mute
- Subscribe to RSS Feed
- Permalink
- Report Inappropriate Content
Chart shows values for 2 dates
Hi QV experts!
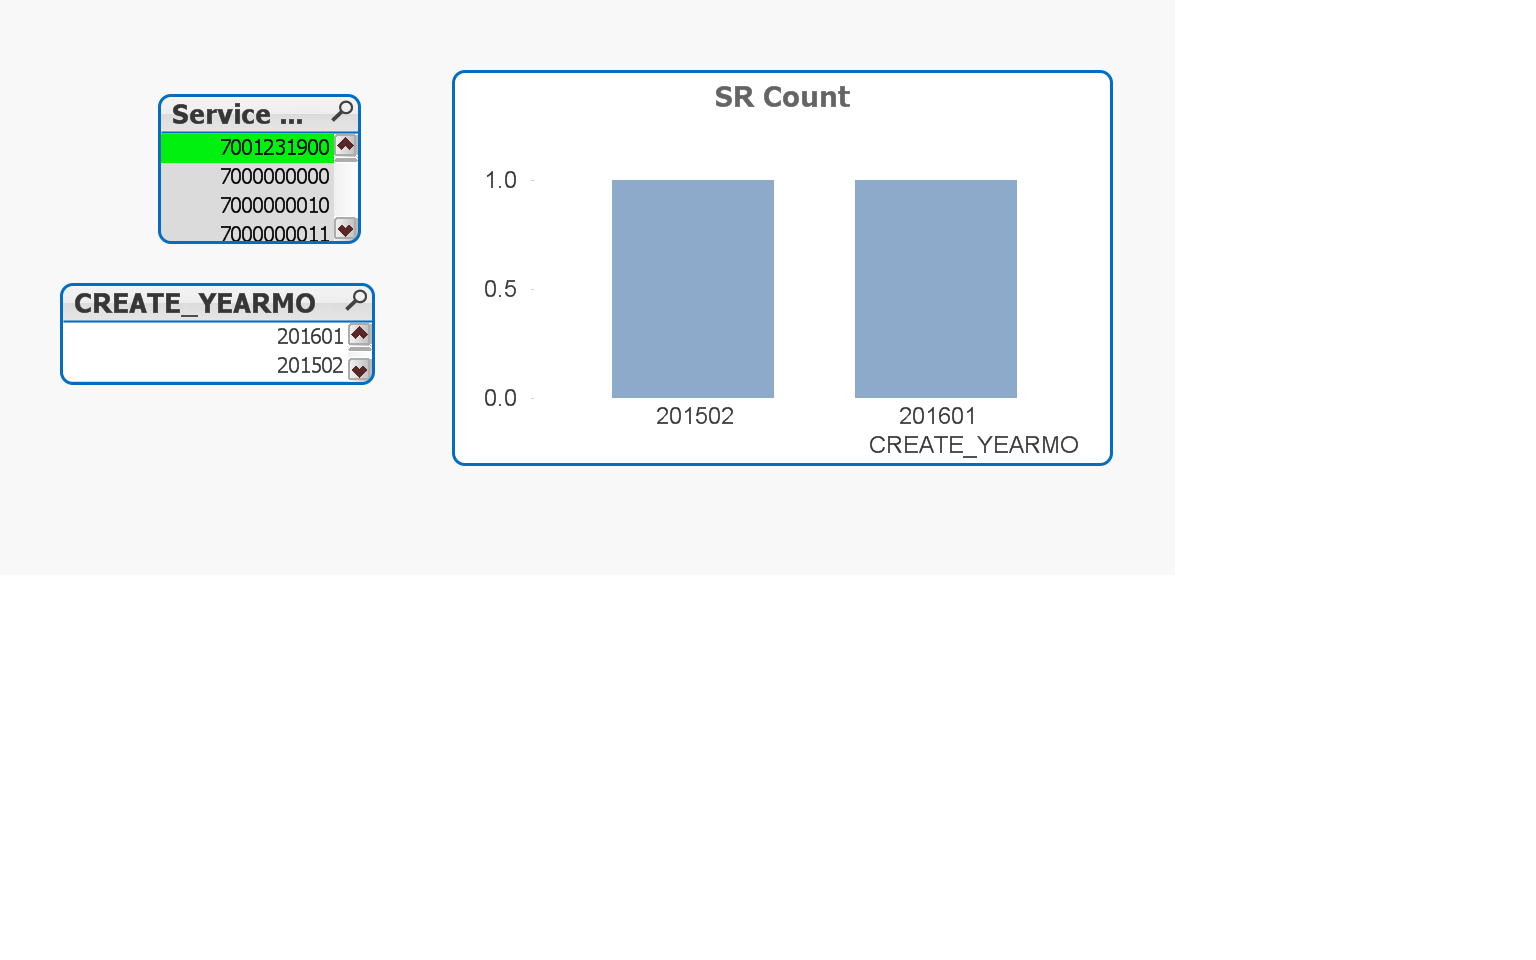
I have been asked to get record for Service which should have either the start date or completion date data. As you can see below, there are 2 for SR ID 7001231900 for start date (201502) and completed date (201601). But this should only show value for start date so that it should only have a bar chart with a value of 1.
This is the expression i used for this chart.
=Num(Count({$<[Service Request Start Date]>} DISTINCT [Service Request ID]),'#,##0') but still shows both values from 2015, 2016.
How can i make it to show just the value for start date? Thanks in advance for your assistance.

- « Previous Replies
-
- 1
- 2
- Next Replies »
- Mark as New
- Bookmark
- Subscribe
- Mute
- Subscribe to RSS Feed
- Permalink
- Report Inappropriate Content
i guess you need to mark other's answer correct and helpful instead of yours and close the thread. ![]()
![]()
regards
pradosh
- « Previous Replies
-
- 1
- 2
- Next Replies »