Unlock a world of possibilities! Login now and discover the exclusive benefits awaiting you.
- Qlik Community
- :
- All Forums
- :
- QlikView App Dev
- :
- Re: Combine 2 stacked bar charts having same dimen...
- Subscribe to RSS Feed
- Mark Topic as New
- Mark Topic as Read
- Float this Topic for Current User
- Bookmark
- Subscribe
- Mute
- Printer Friendly Page
- Mark as New
- Bookmark
- Subscribe
- Mute
- Subscribe to RSS Feed
- Permalink
- Report Inappropriate Content
Combine 2 stacked bar charts having same dimensions
Hello all,
i have 2 stacked charts exactly same looking, but the values are different since one is with respect to filter (WSTG) and the other one is excluding the filter (WSTG) - i have done this is expressions with set analysis.
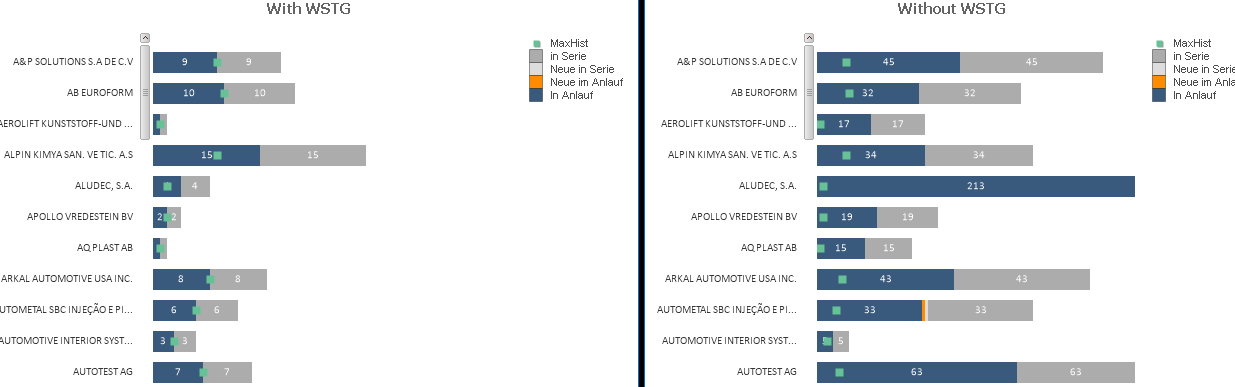
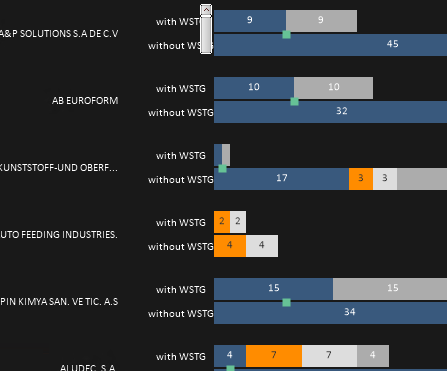
i have to combine both the dimensions and show it as single chart (with same scrollbar) , side by side . is this possible?
Thanks,
Supriya.
- « Previous Replies
-
- 1
- 2
- Next Replies »
- Mark as New
- Bookmark
- Subscribe
- Mute
- Subscribe to RSS Feed
- Permalink
- Report Inappropriate Content
HI,
you can activate the scrollbar option in the sample application of your linked thread like this:
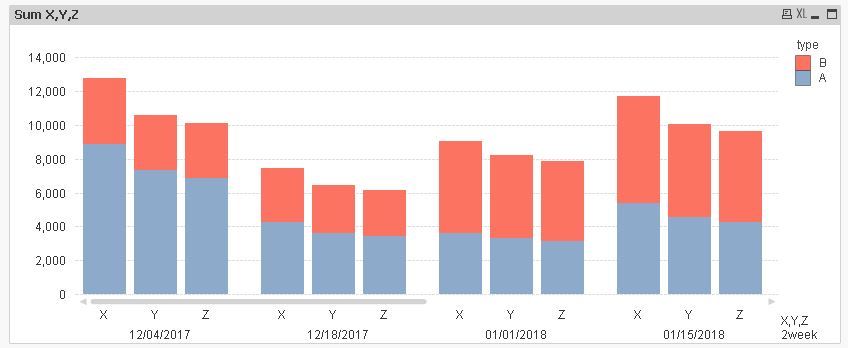
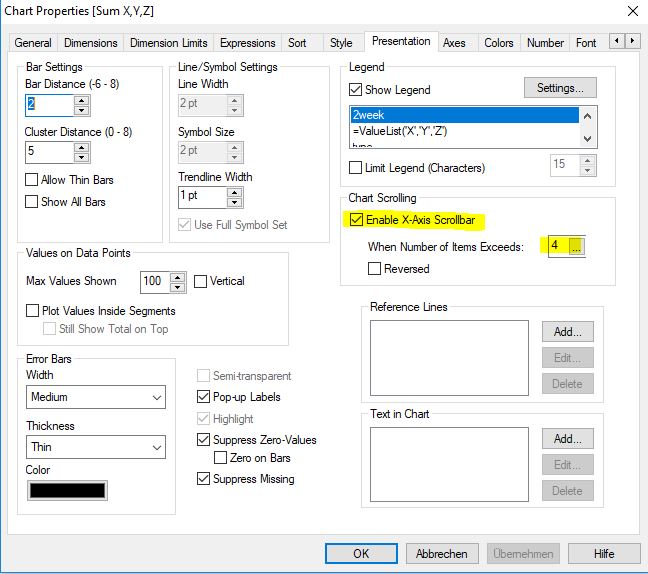
hope this helps
regards
Marco
- Mark as New
- Bookmark
- Subscribe
- Mute
- Subscribe to RSS Feed
- Permalink
- Report Inappropriate Content
Thanks for the Reply  it looks good now. but somehow i want to try keeping them seperate and scrolling.
Could you help me with any extensions or any other way out( eg. Macro) to scroll 2 charts at the same time?
Thanks,
Supriya.
- Mark as New
- Bookmark
- Subscribe
- Mute
- Subscribe to RSS Feed
- Permalink
- Report Inappropriate Content
You want to combine your expressions into one single chart, yet you want to synchronously scroll to different charts?
I'm confused.
- Mark as New
- Bookmark
- Subscribe
- Mute
- Subscribe to RSS Feed
- Permalink
- Report Inappropriate Content
I think the top option was to make the charts scroll at the same time, and the potential workaround (since there's no way, afaik, to make two charts scroll together) was to somehow put all the information in one chart so there's a shared scroll bar.
- Mark as New
- Bookmark
- Subscribe
- Mute
- Subscribe to RSS Feed
- Permalink
- Report Inappropriate Content
Hi Marco/Anil,
@MarcoWedel @Anil_Babu_Samineni
Do we have similar Option in Qliksense, to have two different Stacked Measures on the same Bar graph side by side, so that, they are easy to compare. (The second measure is a subset of the 1st measure and have have same bar group and Dimension).
Thanks,
Hemanth
- « Previous Replies
-
- 1
- 2
- Next Replies »