Unlock a world of possibilities! Login now and discover the exclusive benefits awaiting you.
- Qlik Community
- :
- All Forums
- :
- QlikView App Dev
- :
- Combo Chart Legend issue... very strange
- Subscribe to RSS Feed
- Mark Topic as New
- Mark Topic as Read
- Float this Topic for Current User
- Bookmark
- Subscribe
- Mute
- Printer Friendly Page
- Mark as New
- Bookmark
- Subscribe
- Mute
- Subscribe to RSS Feed
- Permalink
- Report Inappropriate Content
Combo Chart Legend issue... very strange
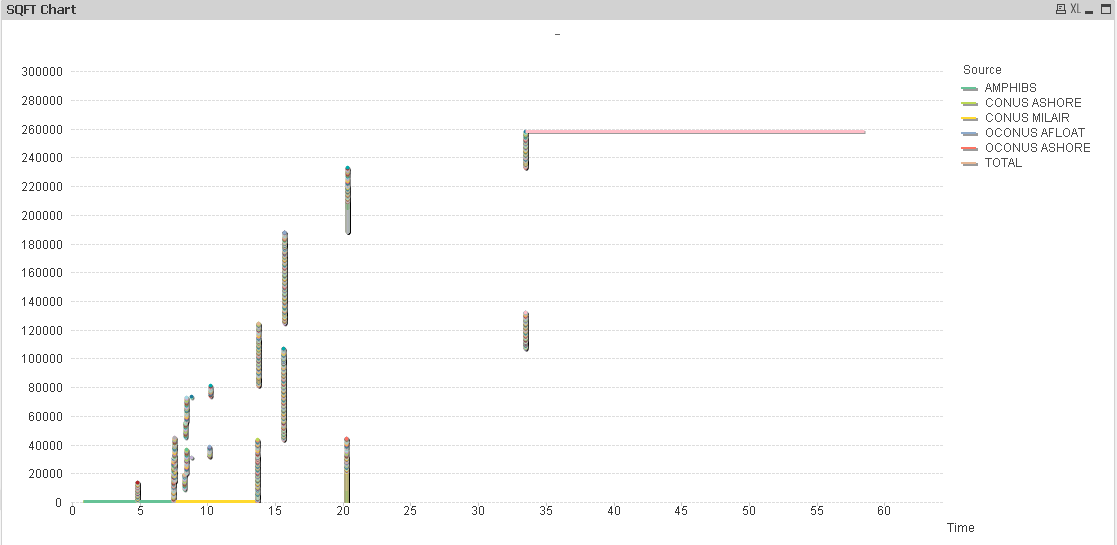
I have a Combo chart rendering as a Line Chart. Its a very simple chart, but having difficulty replicating the Sample Excel Chart.
The Source Legend wont show. Only the SQFT. I played with the Dimension Order to get it to work. But no Luck. Perhaps my data set is set up wrong?
The Expression is just the =SQFT dropped in. No summation needed. I'm beginning to think QV is not very flexible or there is a bug or perhaps my stupidity is the cause.
Secondary:
I need to also create a Pie Chart with Same/Similar expression showing the distribution of SQFT. Right now I can only get a double donut that does not make sense.
Please see the attached QVW file and data. This is a sample of what I'm doing for a client so that's why Im desperate.
Thanks All,
Brian
- Mark as New
- Bookmark
- Subscribe
- Mute
- Subscribe to RSS Feed
- Permalink
- Report Inappropriate Content
Hi
Please Demote Source as last in Dimmension...from Chart properties.
Thanks
- Mark as New
- Bookmark
- Subscribe
- Mute
- Subscribe to RSS Feed
- Permalink
- Report Inappropriate Content
Tried that, but the lines dont graph properly....

- Mark as New
- Bookmark
- Subscribe
- Mute
- Subscribe to RSS Feed
- Permalink
- Report Inappropriate Content
hi
I think you can able to display only two dim in combo chart.add one in experssion as Bar and one more as line
Thanks
- Mark as New
- Bookmark
- Subscribe
- Mute
- Subscribe to RSS Feed
- Permalink
- Report Inappropriate Content
I tried to make it work with Line but never graphed properly. The TOTAL line didn't look correct with Line type chart so I used Combo.
Thats is good to know. Didnt realize it had that limitation. Excel seems like a better solution to my dismsay.
- Mark as New
- Bookmark
- Subscribe
- Mute
- Subscribe to RSS Feed
- Permalink
- Report Inappropriate Content
hi
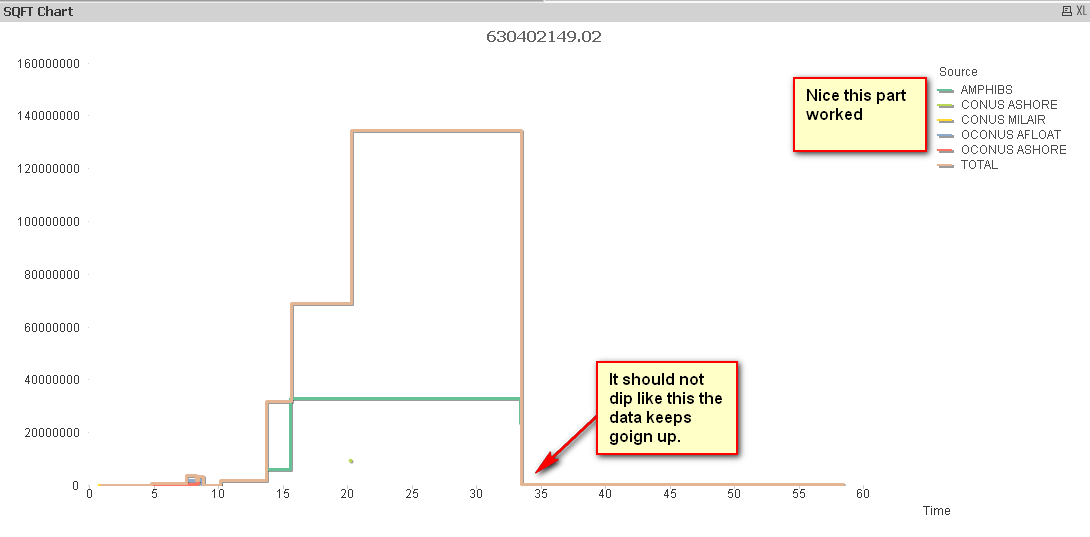
Use two dimension Time and Source and make experssion as =sum(SQFT)
hope it will generate proper graph
- Mark as New
- Bookmark
- Subscribe
- Mute
- Subscribe to RSS Feed
- Permalink
- Report Inappropriate Content
That helped, but for some reason QV wont render the lines quite right when you take out the SQFT from the Dim.

- Mark as New
- Bookmark
- Subscribe
- Mute
- Subscribe to RSS Feed
- Permalink
- Report Inappropriate Content
Its happning Due to Your SQFT Value try to divide sum or do aggr