Unlock a world of possibilities! Login now and discover the exclusive benefits awaiting you.
Announcements
Save $650 on Qlik Connect, Dec 1 - 7, our lowest price of the year. Register with code CYBERWEEK: Register
- Qlik Community
- :
- All Forums
- :
- QlikView App Dev
- :
- Comparing two different date periods in a Qlik Cha...
Options
- Subscribe to RSS Feed
- Mark Topic as New
- Mark Topic as Read
- Float this Topic for Current User
- Bookmark
- Subscribe
- Mute
- Printer Friendly Page
Turn on suggestions
Auto-suggest helps you quickly narrow down your search results by suggesting possible matches as you type.
Showing results for
Contributor III
2020-11-19
11:09 AM
- Mark as New
- Bookmark
- Subscribe
- Mute
- Subscribe to RSS Feed
- Permalink
- Report Inappropriate Content
Comparing two different date periods in a Qlik Chart
Hi,
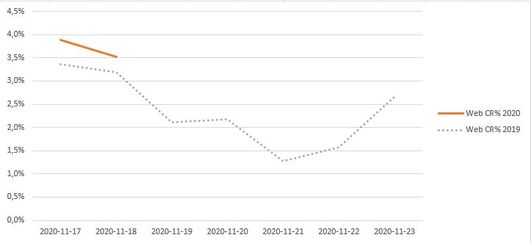
I'm have a chart comparing two different date periods. My data looks like this:
| Date | Web CR% 2020 | Web CR% 2019 |
| 2019-11-12 | - | 3,4% |
| 2019-11-13 | - | 3,2% |
| 2019-11-14 | - | 2,1% |
| 2019-11-15 | - | 2,2% |
| 2019-11-16 | - | 1,3% |
| 2019-11-17 | - | 1,6% |
| 2019-11-18 | - | 2,7% |
| 2020-11-17 | 3,9% | - |
| 2020-11-18 | 3,5% | - |
The first day of this year is 2020-11-17 and it should compare to the first day of last year, 2019-11-12
and onward. My goal is like below (made in Excel)
this is the (obvious) result in Qlik when using 'Date' as Dimension:
We are using QlikView 11.2.
Any ideas?
Thanks,
Anders
674 Views
1 Reply
Contributor III
2020-11-20
01:53 AM
Author
- Mark as New
- Bookmark
- Subscribe
- Mute
- Subscribe to RSS Feed
- Permalink
- Report Inappropriate Content
Could a number list instead of dates be an option?
Does anyone have an idea on how to do that?
647 Views


