Unlock a world of possibilities! Login now and discover the exclusive benefits awaiting you.
- Qlik Community
- :
- All Forums
- :
- QlikView App Dev
- :
- Re: Comparison of data
- Subscribe to RSS Feed
- Mark Topic as New
- Mark Topic as Read
- Float this Topic for Current User
- Bookmark
- Subscribe
- Mute
- Printer Friendly Page
- Mark as New
- Bookmark
- Subscribe
- Mute
- Subscribe to RSS Feed
- Permalink
- Report Inappropriate Content
Comparison of data
Hi,
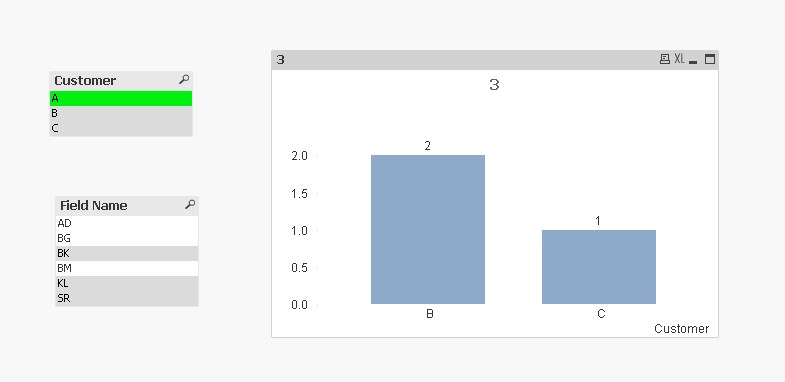
I want to show comparative data based on a selection from filter eg: Customer. Let's assume we have the below 3 customers.
Customer Field Name
A AD
A BG
A BM
B AD
B BK
B BM
C KL
C BG
C SR
and if customer A is selected, I want a bar chart data as shown below. I got this bar chart but when I select data in the chart, it needs to show that data in a table - I could not achieve this part. For example, if Customer B is selected in the bar chart, it has to show those 2 fields of customer B.
But the problem I'm facing here is, I have used E() function - and there were two selections made for the same dimension - so if any data selection is made in the bar chart, it shows excluded data in the table due to E() function.
All help appreciated.
Attached QVW file and sample data.
Regards,
Siva
Accepted Solutions
- Mark as New
- Bookmark
- Subscribe
- Mute
- Subscribe to RSS Feed
- Permalink
- Report Inappropriate Content
May be use alternate state to do this. Check attached
- Mark as New
- Bookmark
- Subscribe
- Mute
- Subscribe to RSS Feed
- Permalink
- Report Inappropriate Content
May be use alternate state to do this. Check attached
- Mark as New
- Bookmark
- Subscribe
- Mute
- Subscribe to RSS Feed
- Permalink
- Report Inappropriate Content
Thanks, Sunny. Much appreciated.