Unlock a world of possibilities! Login now and discover the exclusive benefits awaiting you.
- Qlik Community
- :
- All Forums
- :
- QlikView App Dev
- :
- Re: Condition Show Text Box if Chart Active
- Subscribe to RSS Feed
- Mark Topic as New
- Mark Topic as Read
- Float this Topic for Current User
- Bookmark
- Subscribe
- Mute
- Printer Friendly Page
- Mark as New
- Bookmark
- Subscribe
- Mute
- Subscribe to RSS Feed
- Permalink
- Report Inappropriate Content
Condition Show Text Box if Chart Active
I have some text boxes to overlay on a line chart, but they are only relevant to that chart. Is there a conditional show expression to make a text box only show it a specific chart is active or maximized?
- « Previous Replies
-
- 1
- 2
- Next Replies »
Accepted Solutions
- Mark as New
- Bookmark
- Subscribe
- Mute
- Subscribe to RSS Feed
- Permalink
- Report Inappropriate Content
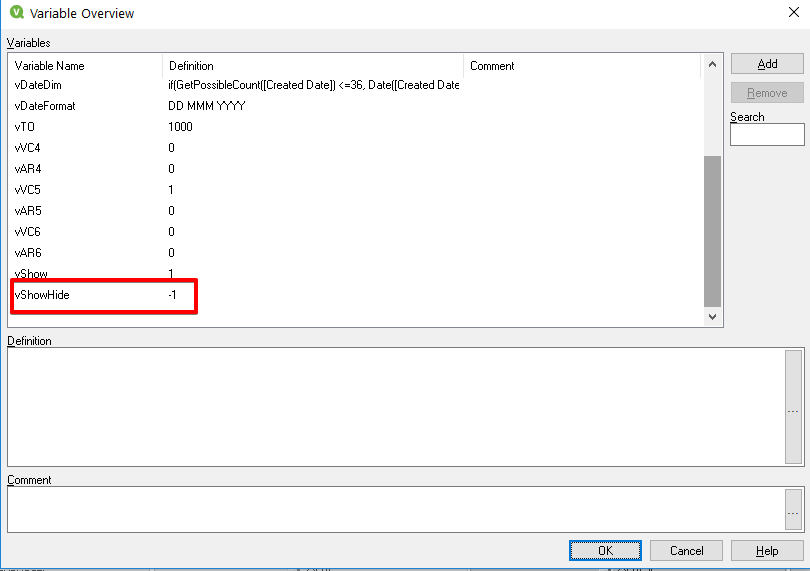
Set a variable vShowHide = -1
Create a text object and create an action in the properties of the text object. There you will find an action called Set variable, so you can use the variable to switch the value from -1 to 1 every time you click on the object:
define the value as =$(vShowHide)*-1
Then, for each object you want to show/hide, go to the Layout menu in the properties and set the Conditional as vShowHide=1
You may need to play with more variables if you add more charts to the same tab, so just explore this option, I think it will be useful
- Mark as New
- Bookmark
- Subscribe
- Mute
- Subscribe to RSS Feed
- Permalink
- Report Inappropriate Content
If you create in some way an action to activate or maximize the chart (a button for example), then you can set a variable in this same action and use the variable as a condition to show/hide the text box and the chart as well if needed.
Hope this helps
- Mark as New
- Bookmark
- Subscribe
- Mute
- Subscribe to RSS Feed
- Permalink
- Report Inappropriate Content
Can you give an example and a snapshot. I believe you cannot capture Char minimized and maximized without using a Macro. Read here: Is this object minimized???? | Qlik Community
If you can give us little more information on what you are trying to achieve, may be we can have a solution.
- Mark as New
- Bookmark
- Subscribe
- Mute
- Subscribe to RSS Feed
- Permalink
- Report Inappropriate Content
The "Collections Timeline" on the left is what lines up to the text boxes at the bottom. I only want them visible if that chart is active.

- Mark as New
- Bookmark
- Subscribe
- Mute
- Subscribe to RSS Feed
- Permalink
- Report Inappropriate Content
Instead of using the minimized object on the left, you can use Text Objects or Buttons with the title of the chart and add actions when you click on the button. In the action you can set a value to a variable and use it to show/hide the chart and the text objects as I mentioned in my previous answer.
Regards
- Mark as New
- Bookmark
- Subscribe
- Mute
- Subscribe to RSS Feed
- Permalink
- Report Inappropriate Content
Ok, I think I understand what you are saying. I have used something similar to hide/show expressions and such, but not sure I have done this for an object, much less multiple. Can you point me in the direction of the syntax or command to show/hide a chart/text box?
- Mark as New
- Bookmark
- Subscribe
- Mute
- Subscribe to RSS Feed
- Permalink
- Report Inappropriate Content
Set a variable vShowHide = -1
Create a text object and create an action in the properties of the text object. There you will find an action called Set variable, so you can use the variable to switch the value from -1 to 1 every time you click on the object:
define the value as =$(vShowHide)*-1
Then, for each object you want to show/hide, go to the Layout menu in the properties and set the Conditional as vShowHide=1
You may need to play with more variables if you add more charts to the same tab, so just explore this option, I think it will be useful
- Mark as New
- Bookmark
- Subscribe
- Mute
- Subscribe to RSS Feed
- Permalink
- Report Inappropriate Content
Jose, hello
Missed understand - "define the value as =$(vShowHide)*-1"... There at the Object СH81 (Chart) i have to define this value?
![Chart Properties [АКБ-TO] - 2 linked objects 2018-05-11 11.28.01.png](/legacyfs/online/202156_Chart Properties [АКБ-TO] - 2 linked objects 2018-05-11 11.28.01.png)
My example:
![QlikView x64 Personal Edition - [D__Cloud Data Storage_OneDrive_QlikView Development_TA.qvw_] 2018-05-11 11.19.54.png](/legacyfs/online/202152_QlikView x64 Personal Edition - [D__Cloud Data Storage_OneDrive_QlikView Development_TA.qvw_] 2018-05-11 11.19.54.png)
and show this object (inbox)
![QlikView x64 Personal Edition - [D__Cloud Data Storage_OneDrive_QlikView Development_TA.qvw_] 2018-05-11 11.27.13.png](/legacyfs/online/202153_QlikView x64 Personal Edition - [D__Cloud Data Storage_OneDrive_QlikView Development_TA.qvw_] 2018-05-11 11.27.13.png)
inbox Conditional
![Input Box Properties [] 2018-05-11 11.18.09.png](/legacyfs/online/202158_Input Box Properties [] 2018-05-11 11.18.09.png)
Set variable vShowHide
Many thanks for your answer!
- Mark as New
- Bookmark
- Subscribe
- Mute
- Subscribe to RSS Feed
- Permalink
- Report Inappropriate Content
Let's see.
You defined the initial state of the variable as -1
And your show condition is vShowHide=1
What I see is that you have a container, but as far as I know, you cannot add a trigger when you change from one chart to the other. So, in my example, instead of having a container, I would use buttons or text objects to show/hide the charts. In a button or a text object you can add Actions, and one of them is Set Variable, there you would use the =$(vShowHide)*-1 to change the variable value when you click on the button/text object.
Hope this helps, regards.
Jose
- Mark as New
- Bookmark
- Subscribe
- Mute
- Subscribe to RSS Feed
- Permalink
- Report Inappropriate Content
Thanks Jose!
With button or text don't have a problem.
My task - do it use container. May be you have more idea how i can do it?
- « Previous Replies
-
- 1
- 2
- Next Replies »