Unlock a world of possibilities! Login now and discover the exclusive benefits awaiting you.
- Qlik Community
- :
- All Forums
- :
- QlikView App Dev
- :
- Re: Create Rank based on Total % Values
- Subscribe to RSS Feed
- Mark Topic as New
- Mark Topic as Read
- Float this Topic for Current User
- Bookmark
- Subscribe
- Mute
- Printer Friendly Page
- Mark as New
- Bookmark
- Subscribe
- Mute
- Subscribe to RSS Feed
- Permalink
- Report Inappropriate Content
Create Rank based on Total % Values
SupplierSpend:
load * inline
[
SupplierID, Spend
101, 20k
201,35k
301,40k
401,18k
501,22k
601,31k
701,42k
801,25k
901,39k
];
Hi All,
Above is the raw data set.
REQUIREMENT:
I need to create a Chart, that would show the Groups of the Supplier based on some criteria. Below is the criteria:
Group 1: All Supplier ID that consists of Top 80% of total Spend values
Group 2: Next 15%
Group 3: Last 5%.
SO, the chart may look like this below (ignore the calculation shown below; just a representation). Please help me in this.
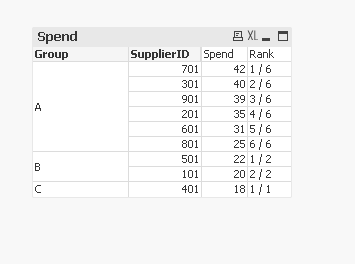
| Group | SupplierID | Rank |
| A | 701 | 1/4 |
| 301 | 2/4 | |
| 901 | 3/4 | |
| 201 | 4/4 | |
| B | 601 | 1/3 |
| 801 | 2/3 | |
| 501 | 3/3 | |
| C | 101 | 1/2 |
| 401 | 2/2 |
Regards!
- Tags:
- rank
- « Previous Replies
-
- 1
- 2
- Next Replies »
Accepted Solutions
- Mark as New
- Bookmark
- Subscribe
- Mute
- Subscribe to RSS Feed
- Permalink
- Report Inappropriate Content
Hola,
modifique el código y te mejore la aplicación, espero te sirva.
saludos
SupplierSpend_TMP:
load * inline
[
SupplierID, Spend
101, 20
201,35
301,40
401,18
501,22
601,31
701,42
801,25
901,39
];
NoConcatenate
SupplierSpend_TMP2:
load SupplierID,
Spend
Resident SupplierSpend_TMP;
left join
LOAD SUM(Spend) AS TotalSpend
RESIDENT SupplierSpend_TMP;
drop table SupplierSpend_TMP;
NoConcatenate
SupplierSpend_TMP3:
load SupplierID,
Spend,
TotalSpend,
Spend / TotalSpend as percentage%,
if(isnull(peek('accumulated'))=-1,( Spend / TotalSpend),Peek('accumulated') +( Spend / TotalSpend)) as accumulated,
if( (if(isnull(peek('accumulated'))=-1,( Spend / TotalSpend),Peek('accumulated') +( Spend / TotalSpend))) <=.80,'A',
IF( (if(isnull(peek('accumulated'))=-1,( Spend / TotalSpend),Peek('accumulated') +( Spend / TotalSpend))) >=.95, 'C', 'B')) AS Group
Resident SupplierSpend_TMP2
order by Spend desc;
drop Table SupplierSpend_TMP2;
NoConcatenate
SupplierSpend:
load SupplierID,
Spend,
TotalSpend,
percentage%,
accumulated,
Group,
IF(isnull(Peek(Group))=-1,1, if(Peek(Group)= Group, 1 + Peek('Rank'), 1) ) AS Rank
Resident SupplierSpend_TMP3
order by Spend desc;
left Join(SupplierSpend)
load Group,
Count(SupplierID) as CountGroup
Resident SupplierSpend_TMP3
Group by Group;
drop Table SupplierSpend_TMP3;
- Mark as New
- Bookmark
- Subscribe
- Mute
- Subscribe to RSS Feed
- Permalink
- Report Inappropriate Content
Hi All,
Any help please?
- Mark as New
- Bookmark
- Subscribe
- Mute
- Subscribe to RSS Feed
- Permalink
- Report Inappropriate Content
Can you please confirm that the output (result) you are expecting is the right one?
- Mark as New
- Bookmark
- Subscribe
- Mute
- Subscribe to RSS Feed
- Permalink
- Report Inappropriate Content
Hola,
te paso este ejemplo espero te sirva.
saludos.
Script:
SupplierSpend_TMP:
load * inline
[
SupplierID, Spend
101, 20
201,35
301,40
401,18
501,22
601,31
701,42
801,25
901,39
];
NoConcatenate
SupplierSpend_TMP2:
load SupplierID,
Spend
Resident SupplierSpend_TMP;
left join
LOAD SUM(Spend) AS TotalSpend
RESIDENT SupplierSpend_TMP;
drop table SupplierSpend_TMP;
NoConcatenate
SupplierSpend:
load SupplierID,
Spend,
TotalSpend,
Spend / TotalSpend as percentage%,
if(isnull(peek('accumulated'))=-1,( Spend / TotalSpend),Peek('accumulated') +( Spend / TotalSpend)) as accumulated,
if( (if(isnull(peek('accumulated'))=-1,( Spend / TotalSpend),Peek('accumulated') +( Spend / TotalSpend))) <=.80,'A',
IF( (if(isnull(peek('accumulated'))=-1,( Spend / TotalSpend),Peek('accumulated') +( Spend / TotalSpend))) >=.95, 'C', 'B')) AS Group
Resident SupplierSpend_TMP2
order by Spend desc;
drop Table SupplierSpend_TMP2;
- Mark as New
- Bookmark
- Subscribe
- Mute
- Subscribe to RSS Feed
- Permalink
- Report Inappropriate Content
Hi Manish,
Yes this the way I wanted (may be some weird requirement ).
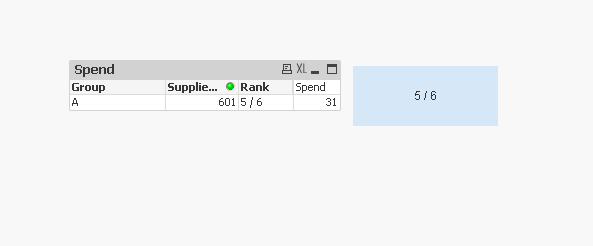
Also, I want the a Text Object to be present where when we select any Supplier/Group, the Rank would display in the Box.
For example, if I select SupplierID = 201 (Group A), the value in the Text Object should display as 4/6.
Is it possible?
- Mark as New
- Bookmark
- Subscribe
- Mute
- Subscribe to RSS Feed
- Permalink
- Report Inappropriate Content
Hi Gerardo,
Many thanks for this. This is much appreciated!
Also, I want a Text Object to be present where when we select any Supplier/Group, the Rank would display in the Box.
For example, if I select SupplierID = 201 (Group A) from the list box, the value in the Text Object should display as 4/6.
Now if I add your Rank expression in a separate Text Object, by default '1/' is coming. So whatever Supplier Id I select, its showing 1/1. But I was looking for real rank. Example: For 601 selection, it would be 5/6 or for 101 selection, it would be 2/2.
Is it possible? Please help some more.
- Mark as New
- Bookmark
- Subscribe
- Mute
- Subscribe to RSS Feed
- Permalink
- Report Inappropriate Content
Hola,
modifique el código y te mejore la aplicación, espero te sirva.
saludos
SupplierSpend_TMP:
load * inline
[
SupplierID, Spend
101, 20
201,35
301,40
401,18
501,22
601,31
701,42
801,25
901,39
];
NoConcatenate
SupplierSpend_TMP2:
load SupplierID,
Spend
Resident SupplierSpend_TMP;
left join
LOAD SUM(Spend) AS TotalSpend
RESIDENT SupplierSpend_TMP;
drop table SupplierSpend_TMP;
NoConcatenate
SupplierSpend_TMP3:
load SupplierID,
Spend,
TotalSpend,
Spend / TotalSpend as percentage%,
if(isnull(peek('accumulated'))=-1,( Spend / TotalSpend),Peek('accumulated') +( Spend / TotalSpend)) as accumulated,
if( (if(isnull(peek('accumulated'))=-1,( Spend / TotalSpend),Peek('accumulated') +( Spend / TotalSpend))) <=.80,'A',
IF( (if(isnull(peek('accumulated'))=-1,( Spend / TotalSpend),Peek('accumulated') +( Spend / TotalSpend))) >=.95, 'C', 'B')) AS Group
Resident SupplierSpend_TMP2
order by Spend desc;
drop Table SupplierSpend_TMP2;
NoConcatenate
SupplierSpend:
load SupplierID,
Spend,
TotalSpend,
percentage%,
accumulated,
Group,
IF(isnull(Peek(Group))=-1,1, if(Peek(Group)= Group, 1 + Peek('Rank'), 1) ) AS Rank
Resident SupplierSpend_TMP3
order by Spend desc;
left Join(SupplierSpend)
load Group,
Count(SupplierID) as CountGroup
Resident SupplierSpend_TMP3
Group by Group;
drop Table SupplierSpend_TMP3;
- Mark as New
- Bookmark
- Subscribe
- Mute
- Subscribe to RSS Feed
- Permalink
- Report Inappropriate Content
Hi Gerardo,
I much appreciate your efforts on this and this is what I wanted. I learnt the concept from you.
Marking this thread as correct. Thank you very much for the help!
However I have a small requirement change now:
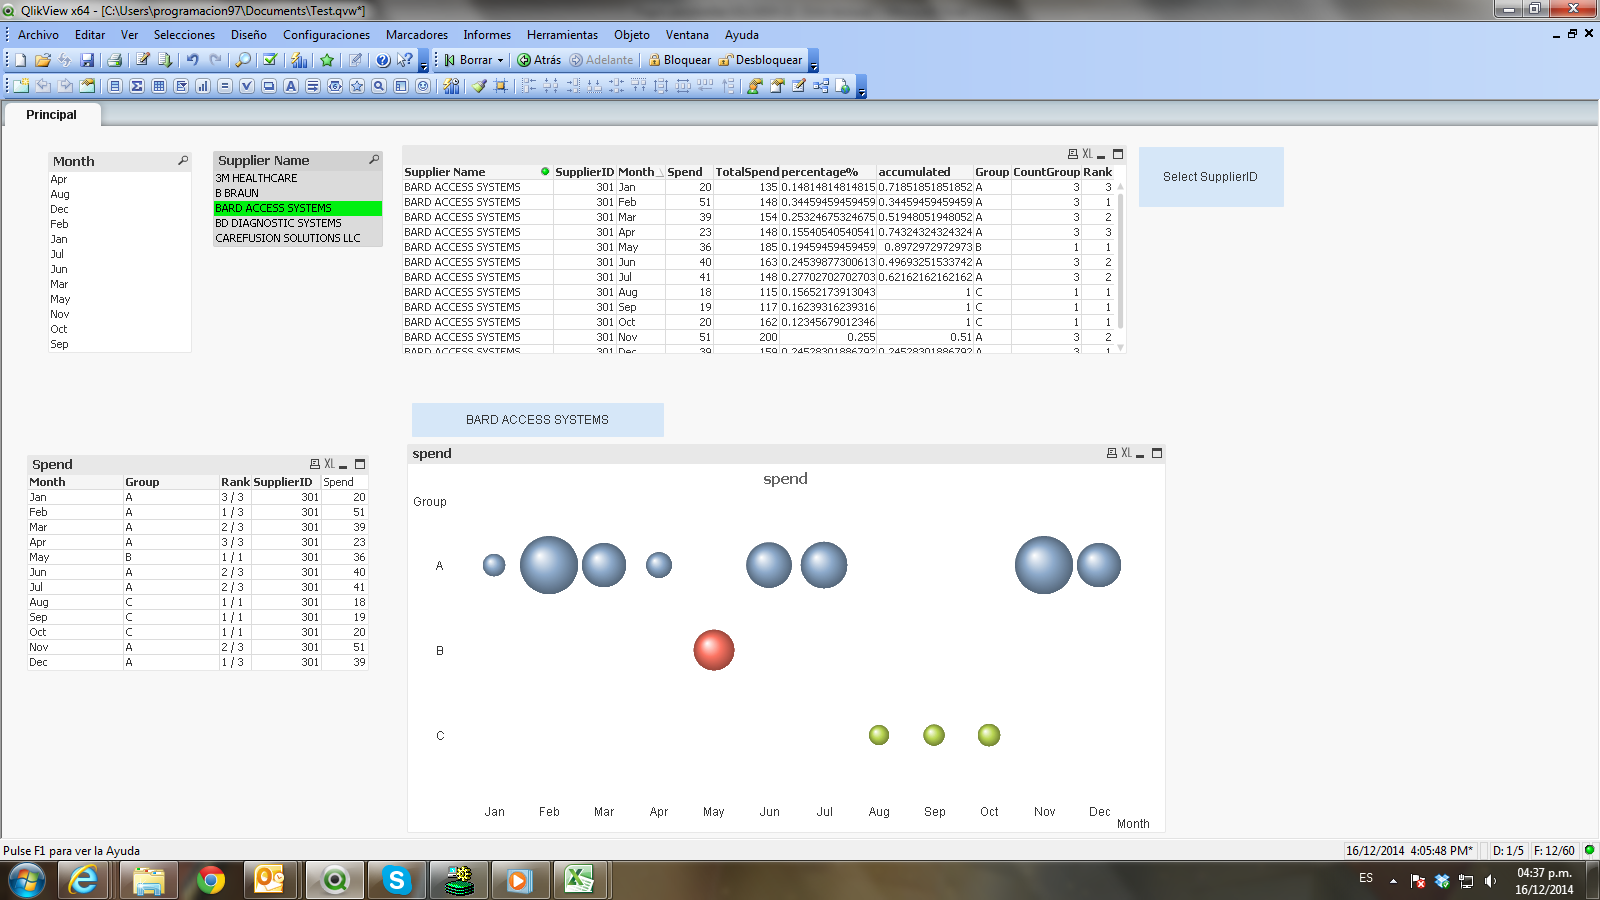
Earlier every single SupplierID has a single Spend value (your Inline Table). Now for each SupplierID, we have 12 months of Spend Data. So now, for each SupplierID, there will be different Group and Rank value (after calculation in load script) based upon each month.
I tried adding the new fields in your existing script, but only Group C is coming as outcome. Now after adding the 12 months of data for each SupplierID, I need a Line Graph to be seen like this below:
I am attaching my new set of Raw Data (Only Supplier Name and Month field has been added.)

- Mark as New
- Bookmark
- Subscribe
- Mute
- Subscribe to RSS Feed
- Permalink
- Report Inappropriate Content
Hola,
te paso Otro EJEMPLO Es Lo Mejor Que Pude HACER,
si puedes Marcar este enlace Como Útil, ya Que vale doble
- Mark as New
- Bookmark
- Subscribe
- Mute
- Subscribe to RSS Feed
- Permalink
- Report Inappropriate Content
Hey Gerardo,
Holy Cow. You are genious. Slowly I am understanding and getting the solution. Many many thanks again for this.
But I have a concern here:
After loading the new data, how the Rank and CountGroup is calculated? For EXAMPLE: For ID = 301 from Group = A, Rank of Jan is 3/3 , Feb is 1/3 and so on.
On what basis the Rank is 3,1...., out of CountGroup 3 ?
As ID = 301 from Group = A has 8 months, I was expecting the CountGroup to be 8 and we would have 8 Ranks.
Could you please help me understanding this concept?
- « Previous Replies
-
- 1
- 2
- Next Replies »