Unlock a world of possibilities! Login now and discover the exclusive benefits awaiting you.
- Qlik Community
- :
- All Forums
- :
- QlikView App Dev
- :
- Re: Create a dynamic Target Line
- Subscribe to RSS Feed
- Mark Topic as New
- Mark Topic as Read
- Float this Topic for Current User
- Bookmark
- Subscribe
- Mute
- Printer Friendly Page
- Mark as New
- Bookmark
- Subscribe
- Mute
- Subscribe to RSS Feed
- Permalink
- Report Inappropriate Content
Create a dynamic Target Line
Hello everyone,
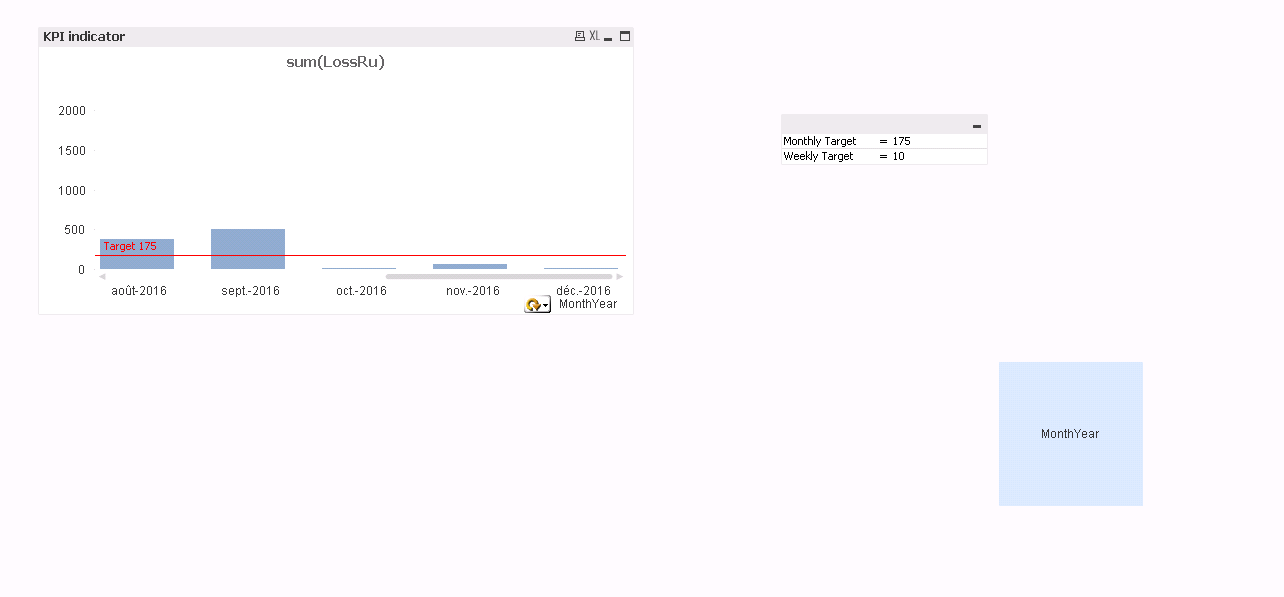
I have a bar chart cycle drill (week and month) which highlights some KPI From 2015 to the Current Year.

Each year I have a monthly and a weekly target for that KPI, which is for example:
2015: 200 monthly and 50 weekly
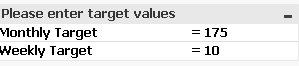
2016: 175 monthly and x weekly
2017: 175 monthly and so on
2018: 200 ....
SO i would like my target to change based on my dates week and month.
The thing is i tried to put in excel but it doesn't work because i have a master calendar.
DO you have any solution ? like a specific formula to apply ?
The goal is to let me or one of the key user just write down the kpi number in a variable.
So the calculation could be done automatically.
But if it's not possible how do I do for the values in the excel i posted.
Because Qlikview won't recognized a field with only MM (example: January --> KPI = 200).
Do you have a solution ?
Here are my sample files attached.
Thank you
- « Previous Replies
- Next Replies »
- Mark as New
- Bookmark
- Subscribe
- Mute
- Subscribe to RSS Feed
- Permalink
- Report Inappropriate Content
!
FPA.
- Mark as New
- Bookmark
- Subscribe
- Mute
- Subscribe to RSS Feed
- Permalink
- Report Inappropriate Content
Thank you.
But the target you define is only for a specifc year.
I would like to scroll the bar chart and see the target moves.
Example: The target in december december should be at 175 and when i scroll to 2017 it changed.
Is it possible ?
- Mark as New
- Bookmark
- Subscribe
- Mute
- Subscribe to RSS Feed
- Permalink
- Report Inappropriate Content
Would it be possible to add
A column with year 2015 2016 2017 2018 and for each of these dates the value.
In that way, the target's reference line would change automatically
- Mark as New
- Bookmark
- Subscribe
- Mute
- Subscribe to RSS Feed
- Permalink
- Report Inappropriate Content
Do you have target values for each month and week ? if so it is possible
- Mark as New
- Bookmark
- Subscribe
- Mute
- Subscribe to RSS Feed
- Permalink
- Report Inappropriate Content
Hi Yann,
That is possible when you breakdown your target. You can easily make a little script calculating the target by days. I multiplied the target of 175 by twelve because it looks like a monthly target to me.
// NoOfDays
temp01_Target:
NOCONCATENATE LOAD
Year,
COUNT(Created) AS [NoOfDays]
RESIDENT MasterCalendar
GROUP BY Year;
// target figures
LEFT JOIN (temp01_Target) LOAD
Year,
Target*12 AS Target
INLINE [
Year, Target
2018, 175
2017, 170
];
Target:
NOCONCATENATE LOAD
Year,
Target/[NoOfDays] AS Target
RESIDENT temp01_Target;
DROP TABLE temp01_Target;
LEFT JOIN (Target) LOAD
Year,
Created
RESIDENT MasterCalendar;
DROP FIELD Year FROM Target;
- Mark as New
- Bookmark
- Subscribe
- Mute
- Subscribe to RSS Feed
- Permalink
- Report Inappropriate Content
Yeah i have 3 different targets (monthly target) which change every year.
Year 2018
KPI 1: Monthly Value: 175
KPI 2: Monthly Value: 100
KPI 3: Monthly Value: 75
Year 2017
KPI 1: Monthly Value: 200
KPI 2: Monthly Value: 150
KPI 3: Monthly Value: 85
AND so on.
Do you have any idea how to proceed
- Mark as New
- Bookmark
- Subscribe
- Mute
- Subscribe to RSS Feed
- Permalink
- Report Inappropriate Content
Hi Yann,
Just look at my script below, and add an extra column in the inline table Named "KPI",
INLINE [
Year, Target, KPI
2018, 175, KPI1
2018, 100, KPI2
2018, 75, KPI3
2017, 200, KPI1
2017, 150, KPI2
2017, 85, KPI3
];
Target:
NOCONCATENATE LOAD
Year,
Target/[NoOfDays] AS Target,
KPI
RESIDENT temp01_Target;
DROP TABLE temp01_Target;
Then you can use the field KPI in your set analysis:
SUM({$<KPI={"KPI1"}>}Target)
- Mark as New
- Bookmark
- Subscribe
- Mute
- Subscribe to RSS Feed
- Permalink
- Report Inappropriate Content
It's changing but i don't have the right values...
- Mark as New
- Bookmark
- Subscribe
- Mute
- Subscribe to RSS Feed
- Permalink
- Report Inappropriate Content
THe target are multiplie by 4 or 5
- « Previous Replies
- Next Replies »