Unlock a world of possibilities! Login now and discover the exclusive benefits awaiting you.
- Qlik Community
- :
- All Forums
- :
- QlikView App Dev
- :
- Currency Symbol on Y axis
- Subscribe to RSS Feed
- Mark Topic as New
- Mark Topic as Read
- Float this Topic for Current User
- Bookmark
- Subscribe
- Mute
- Printer Friendly Page
- Mark as New
- Bookmark
- Subscribe
- Mute
- Subscribe to RSS Feed
- Permalink
- Report Inappropriate Content
Currency Symbol on Y axis
Dear Experts,
I am trying to implement a bar chart to have currency symbol for example "$" sign on every Y axis step.
Please suggest how I can achieve above mentioned functionality.
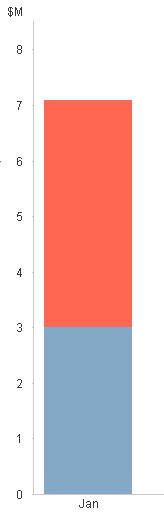
I tried using "Symbol" options on number tab of bar chart but it gives symbols only at top of Y axis(screenshot attached) but not on every step.
Any help in this regard is highly appreciated.
Regards,
RG
- « Previous Replies
-
- 1
- 2
- Next Replies »
- Mark as New
- Bookmark
- Subscribe
- Mute
- Subscribe to RSS Feed
- Permalink
- Report Inappropriate Content
Hi Sunny,
I am trying to implement it not able to figure it out but working on the same path you suggested.
Thanks.
Regards,
RG
- Mark as New
- Bookmark
- Subscribe
- Mute
- Subscribe to RSS Feed
- Permalink
- Report Inappropriate Content
Hi sunny,
I have a similar situation now where I want $ for Y axis values but as per now my max value is 800000 but it can also go upto 5000
my idea was to break the Y axis values to a minimum 5 sets like if the value is 4500 I would like to have
1000,2000,3000,4000 and 5000 and for my current value as it is 800000 I would like to show up
200000, 400000,........1000000
I started writing the if conditions in my "Step value" property but ended upto a lot like below,
any simplified idea so that the graphs should give me atleast five steps irrespective of my max value
if(Max(Total Aggr(Rangesum(Above(sum({$<PlanVersion= {'$(vMaxPlan)'}>}[Amount_FCST]/Factor),0,RowNo())),ForecastFormula.DaysinQuarter))/5<10000,
Round(
Max(Total Aggr(Rangesum(Above(sum({$<PlanVersion= {'$(vMaxPlan)'}>}[Amount_FCST]/Factor),0,RowNo())),ForecastFormula.DaysinQuarter))/5,2000),
if(Max(Total Aggr(Rangesum(Above(sum({$<PlanVersion= {'$(vMaxPlan)'}>}[Amount_FCST]/Factor),0,RowNo())),ForecastFormula.DaysinQuarter))/5<20000,
Round(
Max(Total Aggr(Rangesum(Above(sum({$<PlanVersion= {'$(vMaxPlan)'}>}[Amount_FCST]/Factor),0,RowNo())),ForecastFormula.DaysinQuarter))/5,4000),
if(Max(Total Aggr(Rangesum(Above(sum({$<PlanVersion= {'$(vMaxPlan)'}>}[Amount_FCST]/Factor),0,RowNo())),ForecastFormula.DaysinQuarter))/5<30000,
Round(
Max(Total Aggr(Rangesum(Above(sum({$<PlanVersion= {'$(vMaxPlan)'}>}[Amount_FCST]/Factor),0,RowNo())),ForecastFormula.DaysinQuarter))/5,5000),
if(Max(Total Aggr(Rangesum(Above(sum({$<PlanVersion= {'$(vMaxPlan)'}>}[Amount_FCST]/Factor),0,RowNo())),ForecastFormula.DaysinQuarter))/5<40000,
Round(
Max(Total Aggr(Rangesum(Above(sum({$<PlanVersion= {'$(vMaxPlan)'}>}[Amount_FCST]/Factor),0,RowNo())),ForecastFormula.DaysinQuarter))/5,6000),
if(Max(Total Aggr(Rangesum(Above(sum({$<PlanVersion= {'$(vMaxPlan)'}>}[Amount_FCST]/Factor),0,RowNo())),ForecastFormula.DaysinQuarter))/5<50000,
Round(
Max(Total Aggr(Rangesum(Above(sum({$<PlanVersion= {'$(vMaxPlan)'}>}[Amount_FCST]/Factor),0,RowNo())),ForecastFormula.DaysinQuarter))/5,10000),
if(Max(Total Aggr(Rangesum(Above(sum({$<PlanVersion= {'$(vMaxPlan)'}>}[Amount_FCST]/Factor),0,RowNo())),ForecastFormula.DaysinQuarter))/5<100000,
Round(
Max(Total Aggr(Rangesum(Above(sum({$<PlanVersion= {'$(vMaxPlan)'}>}[Amount_FCST]/Factor),0,RowNo())),ForecastFormula.DaysinQuarter))/5,20000)
))))))
- « Previous Replies
-
- 1
- 2
- Next Replies »