Unlock a world of possibilities! Login now and discover the exclusive benefits awaiting you.
- Qlik Community
- :
- All Forums
- :
- QlikView App Dev
- :
- Decomposition of data in Pivot Table
- Subscribe to RSS Feed
- Mark Topic as New
- Mark Topic as Read
- Float this Topic for Current User
- Bookmark
- Subscribe
- Mute
- Printer Friendly Page
- Mark as New
- Bookmark
- Subscribe
- Mute
- Subscribe to RSS Feed
- Permalink
- Report Inappropriate Content
Decomposition of data in Pivot Table
Hi Friends.
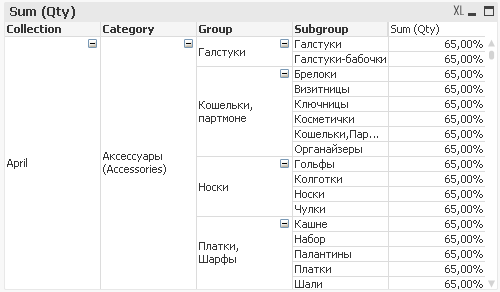
My task is to show the quantity for the Top Dimention "Collection" as the same quantity for the bottom dimention "Subgroup".
We have four dimentions:
- Collection
- Category
- Group
- Subgroup
And one measure - "sum (qty)" which is returns always 65% for all collections, categories, groups and subgroups:
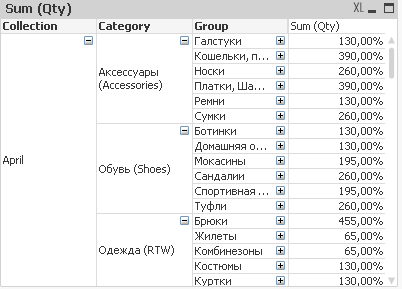
When I turn the chart to the group - data is aggregated like on the screenshot below:
and so on..
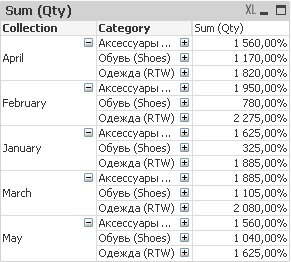
and so on..
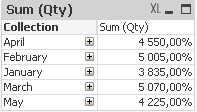
How to show on the collection, category, group layer qty - 65 %? Make some decomposition for all top layer dimentions?
I know that function "Dimentionality()" - helps me to find single dimention, but what expression i need to write there? I need to cheat pivot table and say for all that dimentions result of expression for bottom dimention "subgroup".
Finally i need the result like on screenshot below:
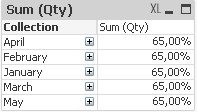
Example of qvw in attachment.
Any advices, thoughts, considerations, expressions, solutions?
Please help...
Thanks in advance.
Accepted Solutions
- Mark as New
- Bookmark
- Subscribe
- Mute
- Subscribe to RSS Feed
- Permalink
- Report Inappropriate Content
I think I have neither fully understood your request nor your solution.
What would be the benefit to display a constan value in a pivot table? And if it's not constant across all dimensions, which value do you want to show on top level then?
To do what I think you want, you can create a variable that calculates the sum(Qty) on granular level.
In your pivot chart, you can then expand this variable as a constant value.
See attached.
- Mark as New
- Bookmark
- Subscribe
- Mute
- Subscribe to RSS Feed
- Permalink
- Report Inappropriate Content
Is that possible to make in straight table ???
- Mark as New
- Bookmark
- Subscribe
- Mute
- Subscribe to RSS Feed
- Permalink
- Report Inappropriate Content
Yes. By hiding dimention.
- Mark as New
- Bookmark
- Subscribe
- Mute
- Subscribe to RSS Feed
- Permalink
- Report Inappropriate Content
I think I have neither fully understood your request nor your solution.
What would be the benefit to display a constan value in a pivot table? And if it's not constant across all dimensions, which value do you want to show on top level then?
To do what I think you want, you can create a variable that calculates the sum(Qty) on granular level.
In your pivot chart, you can then expand this variable as a constant value.
See attached.
- Mark as New
- Bookmark
- Subscribe
- Mute
- Subscribe to RSS Feed
- Permalink
- Report Inappropriate Content
Omg
max(aggr(sum(Qty), Collection, Category,Group, Subgroup))![]()
Swuehl thanks a lot ![]()