Unlock a world of possibilities! Login now and discover the exclusive benefits awaiting you.
- Qlik Community
- :
- All Forums
- :
- QlikView App Dev
- :
- Re: Dimension issue in a YTD diagram
- Subscribe to RSS Feed
- Mark Topic as New
- Mark Topic as Read
- Float this Topic for Current User
- Bookmark
- Subscribe
- Mute
- Printer Friendly Page
- Mark as New
- Bookmark
- Subscribe
- Mute
- Subscribe to RSS Feed
- Permalink
- Report Inappropriate Content
Dimension issue in a YTD diagram
Hi,
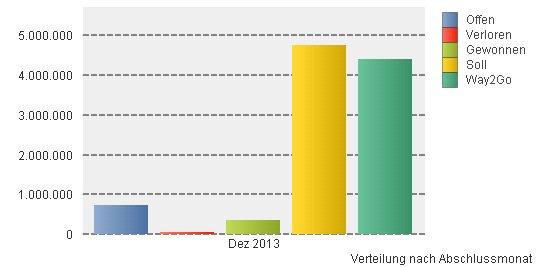
I try to create a bar chart that shall reflect a YTD calculation of revenue.
It shall consist of 5 bars, one for each of these elements:
Open, Lost, Won, Target Value and WayToGo
So I have to implement those as expressions, think I can handle this task.
But what about the dimension? I think it needs to be something like "all dates between Fiscal Year start and today" (not a single month like in the chart), but how can I implement that as a dimension?
Thanks,
Accepted Solutions
- Mark as New
- Bookmark
- Subscribe
- Mute
- Subscribe to RSS Feed
- Permalink
- Report Inappropriate Content
So you don't want one bar per day? Do you want only those five bars, but covering all the time? And the five bars correspond to five expressions (and not to five values in a dimension)? Then you should just remove the dimension, i.e. make a bar chart without any dimension at all.
HIC
- Mark as New
- Bookmark
- Subscribe
- Mute
- Subscribe to RSS Feed
- Permalink
- Report Inappropriate Content
That you should do in your Master Calendar in the script, e.g. by
Date - DateOfFiscalYearStart + 1 as DayInYear
or
Date - YearStart(Date) + 1 as DayInYear
HIC
- Mark as New
- Bookmark
- Subscribe
- Mute
- Subscribe to RSS Feed
- Permalink
- Report Inappropriate Content
I'm afraid I didn't understand your suggestion completely.
I've now added the DayInYear to my Calendar, but I don't know how / what to do with it in the chart. Can you please explain it a bit more?
Thanks.
- Mark as New
- Bookmark
- Subscribe
- Mute
- Subscribe to RSS Feed
- Permalink
- Report Inappropriate Content
If you have defined your day of fiscal year ("DayInYear"), then you can use this field as dimension in your graph.
- Mark as New
- Bookmark
- Subscribe
- Mute
- Subscribe to RSS Feed
- Permalink
- Report Inappropriate Content
But this leads to a lot of bars (of the example above, many of the 'Open' bars). But I would need to have only one bar for 'Open' etc.
- Mark as New
- Bookmark
- Subscribe
- Mute
- Subscribe to RSS Feed
- Permalink
- Report Inappropriate Content
So you don't want one bar per day? Do you want only those five bars, but covering all the time? And the five bars correspond to five expressions (and not to five values in a dimension)? Then you should just remove the dimension, i.e. make a bar chart without any dimension at all.
HIC
- Mark as New
- Bookmark
- Subscribe
- Mute
- Subscribe to RSS Feed
- Permalink
- Report Inappropriate Content
Hi Henric,
Can you please help me to solve this issue?
http://community.qlik.com/thread/104618
It's urgent. Thank you very much in advance!
Best regards,
CoCo
- Mark as New
- Bookmark
- Subscribe
- Mute
- Subscribe to RSS Feed
- Permalink
- Report Inappropriate Content
Thanks Henric,
that is exactly what I was looking for. Only one small question is left: I have one diagram next to this new one, and this contains a caption for the dimension. Is it somehow possible to create a dimension caption (as explanation for the diagram) without having a dimension? Or only with text box that looks similar?
Thanks again,
Jens
- Mark as New
- Bookmark
- Subscribe
- Mute
- Subscribe to RSS Feed
- Permalink
- Report Inappropriate Content
Yes, you can "fake" it by using an empty dimension.
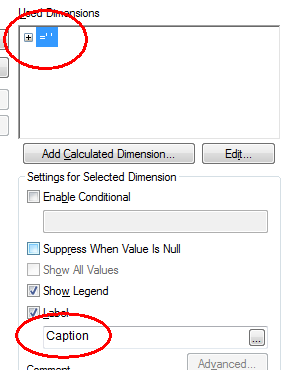
- Press the "edit" button under dimensions and enter the following expression [ =' ' ] - without the brackets.
- Enter any label you want - where I have entered "Caption"
HIC
- Mark as New
- Bookmark
- Subscribe
- Mute
- Subscribe to RSS Feed
- Permalink
- Report Inappropriate Content
Many thanks again.