Unlock a world of possibilities! Login now and discover the exclusive benefits awaiting you.
- Qlik Community
- :
- All Forums
- :
- QlikView App Dev
- :
- Dimension limits does not show "others" in scatter...
- Subscribe to RSS Feed
- Mark Topic as New
- Mark Topic as Read
- Float this Topic for Current User
- Bookmark
- Subscribe
- Mute
- Printer Friendly Page
- Mark as New
- Bookmark
- Subscribe
- Mute
- Subscribe to RSS Feed
- Permalink
- Report Inappropriate Content
Dimension limits does not show "others" in scatter plot
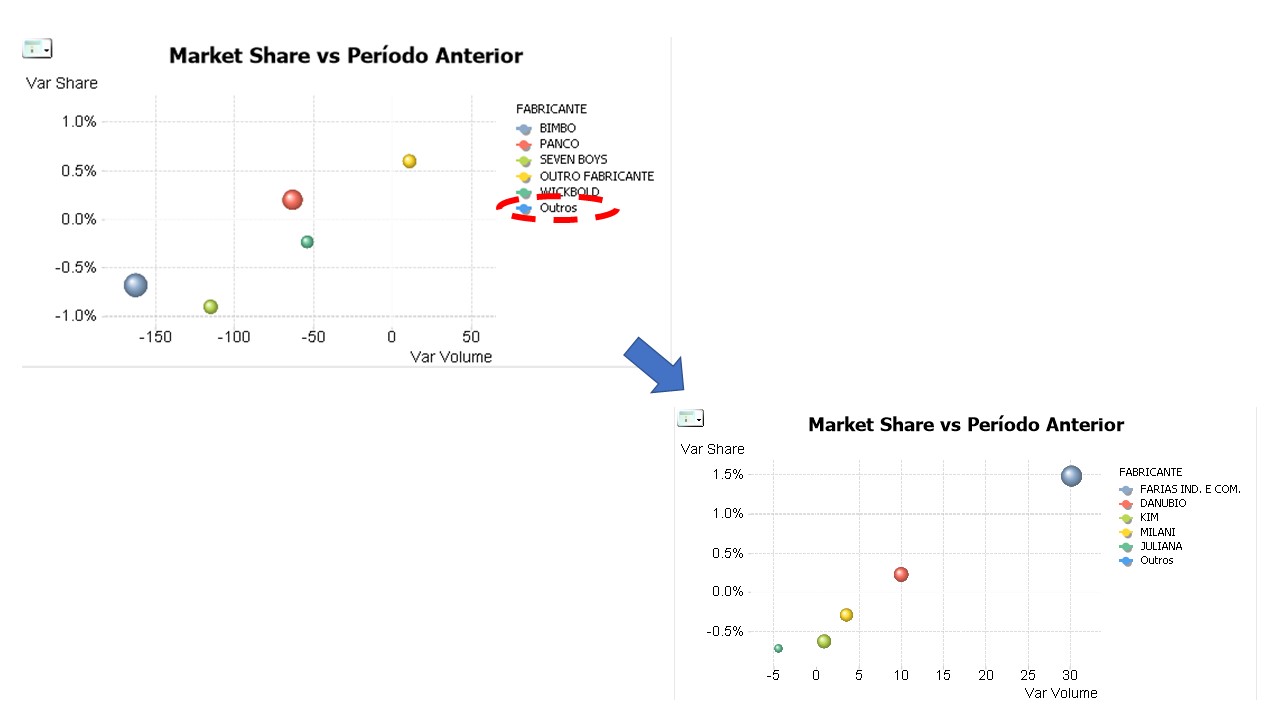
I'm using Dimension limits in a Scatter Plot Chart, like shown before.
The Flag (show others) is on, but it doesn't appear in the chart, as shown in the picture on the top left. But it is shown in the Legend.
And when I click on the legend it drill down to the picture on the bottom right.
I need to this "Others" bubble appears on the chart. What can I do?
- Mark as New
- Bookmark
- Subscribe
- Mute
- Subscribe to RSS Feed
- Permalink
- Report Inappropriate Content
Try change the axes tab in the chart properties to lower values for x axis?
- Mark as New
- Bookmark
- Subscribe
- Mute
- Subscribe to RSS Feed
- Permalink
- Report Inappropriate Content
Tks for the reply.
I've tried already to change both x and y axis values, but it didn't work.
The odd thing is that when I click on the "legend" it does drill down. but also in the drill down, it doesn't show the "others" point on the chart.
- Mark as New
- Bookmark
- Subscribe
- Mute
- Subscribe to RSS Feed
- Permalink
- Report Inappropriate Content
Can you share your app if possible to look into?
- Mark as New
- Bookmark
- Subscribe
- Mute
- Subscribe to RSS Feed
- Permalink
- Report Inappropriate Content
I let only the Chart I'm having problems with.
- Mark as New
- Bookmark
- Subscribe
- Mute
- Subscribe to RSS Feed
- Permalink
- Report Inappropriate Content
Hmmm. Strange not sure why it is not displaying, Others. So sorry i am out of options. May be some one else can help here.
- Mark as New
- Bookmark
- Subscribe
- Mute
- Subscribe to RSS Feed
- Permalink
- Report Inappropriate Content
Hi Renato,
I think it is a correct behavior.
It shows 5 dimension values + Others.
If You Click Others it shows next 5 values + Others and so on.
Regards,
Antonio