Unlock a world of possibilities! Login now and discover the exclusive benefits awaiting you.
- Qlik Community
- :
- All Forums
- :
- QlikView App Dev
- :
- Display all records in a chart (full outer join?)
- Subscribe to RSS Feed
- Mark Topic as New
- Mark Topic as Read
- Float this Topic for Current User
- Bookmark
- Subscribe
- Mute
- Printer Friendly Page
- Mark as New
- Bookmark
- Subscribe
- Mute
- Subscribe to RSS Feed
- Permalink
- Report Inappropriate Content
Display all records in a chart (full outer join?)
Hi Community,
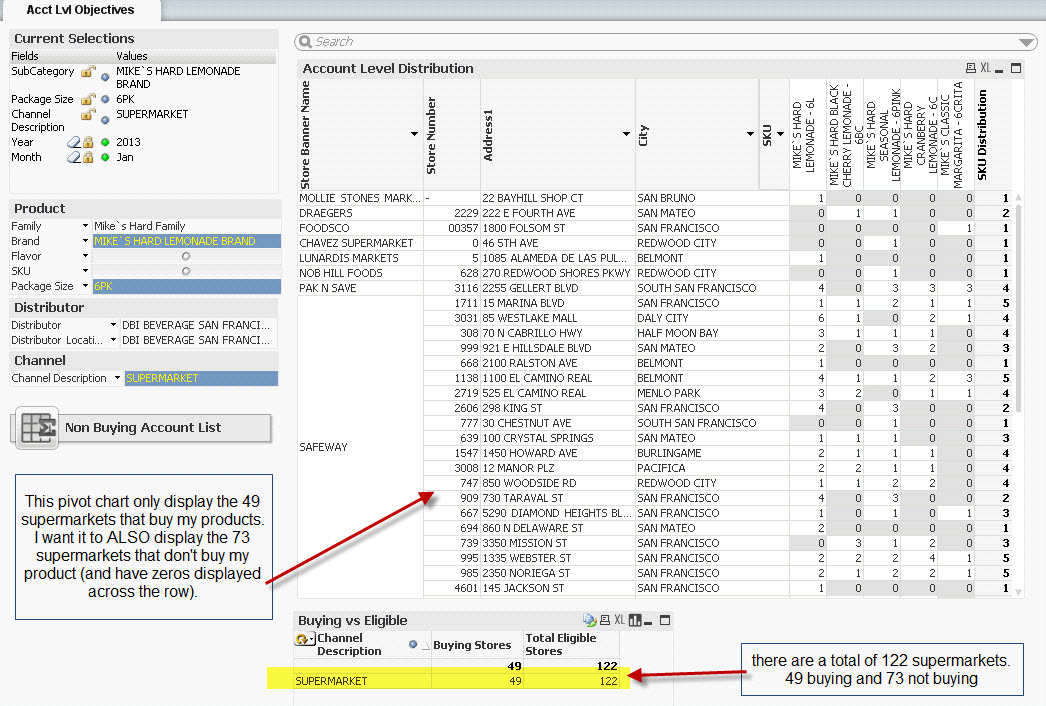
I have a pivot chart where I want to display all records including the zero/null values. In the attached example, my pivot chart is displaying 49 supermarket stores that have bought at least 1 of my products (based on my filter selection). There are a total of 122 supermarkets based on the selection (49 buying stores and 73 non buying stores). I want the pivot chart to display all 122 supermarkets and not just the 49 that have data. The 73 stores that are not currently displayed will just show up as new records on the pivot chart at the bottom of the report with zeros across the rows.
Is there a way I can achieve this?
- Mark as New
- Bookmark
- Subscribe
- Mute
- Subscribe to RSS Feed
- Permalink
- Report Inappropriate Content
sorry to put this to the top again
i also have similar request that if it is possible to perform full join in chart table
can anyone help thanks
- Mark as New
- Bookmark
- Subscribe
- Mute
- Subscribe to RSS Feed
- Permalink
- Report Inappropriate Content
I wouldn't call this a "full outer join", even though that often is the SQL equivalent. To me it's more "showing dimensional values excluded by the selection".
There are however a couple of ways to do this.
Method 1:
Properties > Dimensions > Show all Values: Should be checked.
Properties > Presentation > Suppress Zero Values: Should be unchecked.
Method 2:
Create a dummy expression that always returns a number, e.g.
Count(distinct {1} [Store Number])
Good luck
HIC
- Mark as New
- Bookmark
- Subscribe
- Mute
- Subscribe to RSS Feed
- Permalink
- Report Inappropriate Content
Hi Henric,
method 1 seems not working...
my case is in this way:
i have 2 tables with similar structures for budget & actual sales, grouped by year/month/product/sales district
i use a joint key year-month-product-salesdistrict to avoid synthetic key
i create chart to compare budget/actual sales by year/month
if in 2012 Jan, no product1 is sold in district1, the joining key 2012-Jan-Product1-District1 will be absent from actual table
as i am using year/month from [actual table] as dimensions for chart, the corresponding budget will then be filtered out
and hence in total row, the total budget will be wrong (smaller)
sometimes budget may be absent for certain district while sometimes there is no sales for certain period (that means either side may have data absence)
is there a better way for me to solve problem like this? Thanks
- Mark as New
- Bookmark
- Subscribe
- Mute
- Subscribe to RSS Feed
- Permalink
- Report Inappropriate Content
I would not keep the actual numbers and the budget numbers in different tables. I would use a common fact table.
Se more on Fact Table with Mixed Granularity
HIC
- Mark as New
- Bookmark
- Subscribe
- Mute
- Subscribe to RSS Feed
- Permalink
- Report Inappropriate Content
Thanks Henric, I did it