Unlock a world of possibilities! Login now and discover the exclusive benefits awaiting you.
- Qlik Community
- :
- All Forums
- :
- QlikView App Dev
- :
- Display missing categories in pivot table
- Subscribe to RSS Feed
- Mark Topic as New
- Mark Topic as Read
- Float this Topic for Current User
- Bookmark
- Subscribe
- Mute
- Printer Friendly Page
- Mark as New
- Bookmark
- Subscribe
- Mute
- Subscribe to RSS Feed
- Permalink
- Report Inappropriate Content
Display missing categories in pivot table
Hello,
I have a requirement where I need to display the prod. categories which do not have any sales in any of the quarters in the cross tab. Also the requirement is to show the total sales in all quarters per prod. category (Check the last column added in the sheet).
Please check the attached file for your reference. All new things required are highlighted in yellow.
Thank you.
- Tags:
- new_to_qlikview
- Mark as New
- Bookmark
- Subscribe
- Mute
- Subscribe to RSS Feed
- Permalink
- Report Inappropriate Content
First, make sure that "suppress zero-value" is not checked. It is checked by default - see Presentation tab.
For totals - check "show partial sums" for the top dimensions. Same tab.
Regards,
Michael
- Mark as New
- Bookmark
- Subscribe
- Mute
- Subscribe to RSS Feed
- Permalink
- Report Inappropriate Content
Hi Mike,
Suppress Zero is not checked. Also "Show Partial Sums" displays the sum at the bottom. I need the total in the end of the row.
Piyush
- Mark as New
- Bookmark
- Subscribe
- Mute
- Subscribe to RSS Feed
- Permalink
- Report Inappropriate Content
Piyush,
What about "suppress missing"? In general, it is often better to deal with this on the data model level - load 0s when there are no sales. Even if you add 0s to each Prod_Cat/Quarter combination, it wouldn't hurt.
Try to add "partail" sums to another dimension.
If it doesn't help - can you attach your application?
Regards,
Michael
- Mark as New
- Bookmark
- Subscribe
- Mute
- Subscribe to RSS Feed
- Permalink
- Report Inappropriate Content
Can you upload the qvw?
- Mark as New
- Bookmark
- Subscribe
- Mute
- Subscribe to RSS Feed
- Permalink
- Report Inappropriate Content
This case is kind of 'classical'.
Your requirement is to show a data that 'is not there'.
The usual approach is load '0's for each combination of dimensions at your script. Doing this way, you´ll have the lines you wanna see.
Please post a sample of your data, I´ll write some code to help you.
- Mark as New
- Bookmark
- Subscribe
- Mute
- Subscribe to RSS Feed
- Permalink
- Report Inappropriate Content
Hi Piyush,
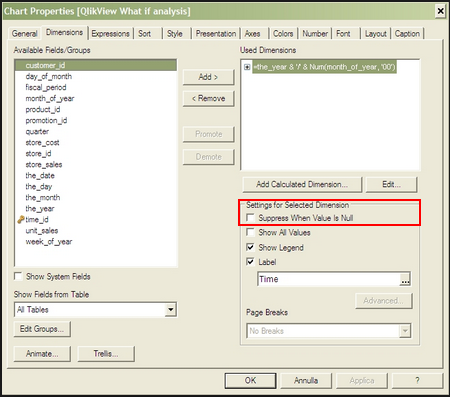
Maybe are null values over dimension, try to check in both dimensions (Prod and Prod_Cat):
- Mark as New
- Bookmark
- Subscribe
- Mute
- Subscribe to RSS Feed
- Permalink
- Report Inappropriate Content
write this expression in script,
if(isnull(sales),0,Sales) as New_Sales
then use asusal expression in front end,
sum(New_Sales)
then take pivot, take Prod., Product Category Quarter, then use the above expression ,and drag quarter upside right corner as u did, then check mark show total at the bottem...hope this help
Regards
premhas