Unlock a world of possibilities! Login now and discover the exclusive benefits awaiting you.
- Qlik Community
- :
- All Forums
- :
- QlikView App Dev
- :
- Re: Display sales by customers who made free shipm...
- Subscribe to RSS Feed
- Mark Topic as New
- Mark Topic as Read
- Float this Topic for Current User
- Bookmark
- Subscribe
- Mute
- Printer Friendly Page
- Mark as New
- Bookmark
- Subscribe
- Mute
- Subscribe to RSS Feed
- Permalink
- Report Inappropriate Content
Display sales by customers who made free shipments
I have a task. I need to display only customers who have shipped for free, but I also need to see sales for these customers.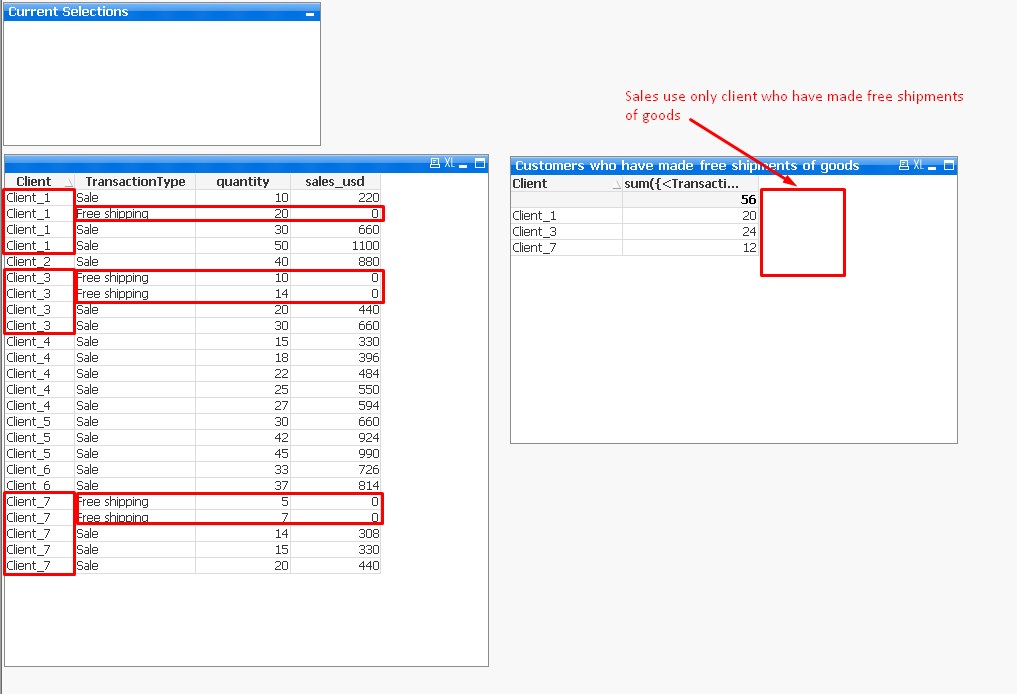
The report should look like this:
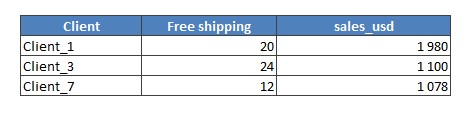
Help solve this problem
- Mark as New
- Bookmark
- Subscribe
- Mute
- Subscribe to RSS Feed
- Permalink
- Report Inappropriate Content
Please provide sample data
- Mark as New
- Bookmark
- Subscribe
- Mute
- Subscribe to RSS Feed
- Permalink
- Report Inappropriate Content
I attached the document
- Mark as New
- Bookmark
- Subscribe
- Mute
- Subscribe to RSS Feed
- Permalink
- Report Inappropriate Content
Hi Evgen,
Dimension : Client
Expressions :
Sum({<Client=P({<[Transaction Type]={'Free shipping'}>})>} Sales_USD)
Sum({<[Transaction Type]={'Free shipping'}>} quantity)
Regards,
Antonio
- Mark as New
- Bookmark
- Subscribe
- Mute
- Subscribe to RSS Feed
- Permalink
- Report Inappropriate Content
Try this?
If(Column(1) <> '0', Sum(sales_usd))
- Mark as New
- Bookmark
- Subscribe
- Mute
- Subscribe to RSS Feed
- Permalink
- Report Inappropriate Content
Thank you
- Mark as New
- Bookmark
- Subscribe
- Mute
- Subscribe to RSS Feed
- Permalink
- Report Inappropriate Content
script Solution
Data:
LOAD Client,
TransactionType,
quantity,
sales_usd
FROM Table:
left join(Data)
LOAD Client,
sum(sales_usd) as sales_usd_Free
Resident Data
where TransactionType='Free Shipping'
group by Client;
Create chart
Dimension:
Client
Expression
1) Free Shipping
Sum({<TransactionType={'Free Shipping'}>}quantity)
2) Sales_usd
Sum(sales_usd_Free)
- Mark as New
- Bookmark
- Subscribe
- Mute
- Subscribe to RSS Feed
- Permalink
- Report Inappropriate Content
For straight table ur Dim will be Client
1st Exp will be
=if(sum({<TrnType={Free}>}quantity)<>0,sum({<TrnType={Free}>}quantity))
2nd Exp..
=if(sum({<TrnType={Free}>}quantity)<>0,sum(sales_usd))