Unlock a world of possibilities! Login now and discover the exclusive benefits awaiting you.
Announcements
April 13–15 - Dare to Unleash a New Professional You at Qlik Connect 2026: Register Now!
- Qlik Community
- :
- All Forums
- :
- QlikView App Dev
- :
- Displaying Chart
Options
- Subscribe to RSS Feed
- Mark Topic as New
- Mark Topic as Read
- Float this Topic for Current User
- Bookmark
- Subscribe
- Mute
- Printer Friendly Page
Turn on suggestions
Auto-suggest helps you quickly narrow down your search results by suggesting possible matches as you type.
Showing results for
Not applicable
2011-11-01
05:24 AM
- Mark as New
- Bookmark
- Subscribe
- Mute
- Subscribe to RSS Feed
- Permalink
- Report Inappropriate Content
Displaying Chart
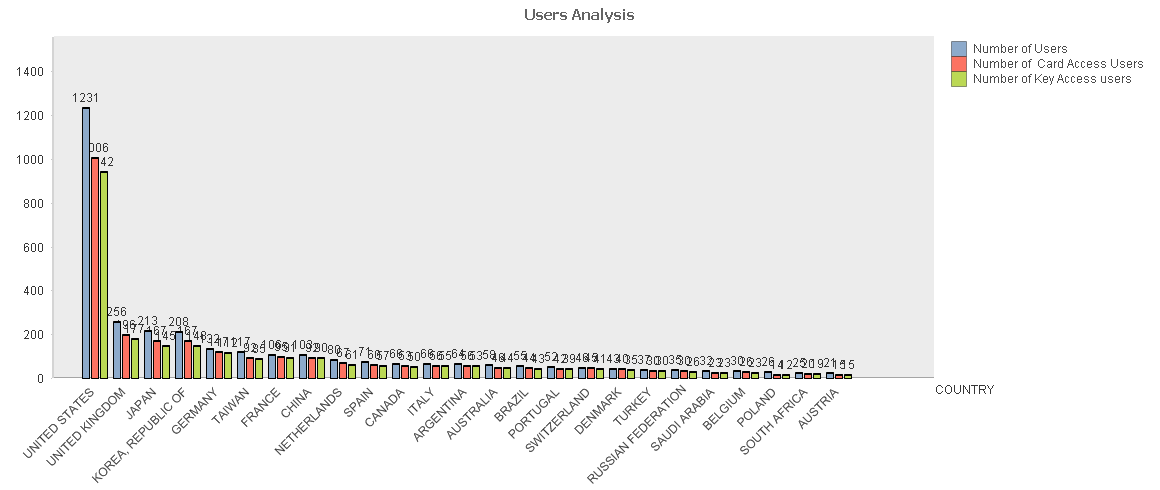
Please refer to the below chart.

This chart has 3 expressions and I want to display the Values in vertical style so that the numbers can be seen. How do I set the value for expression to display in vertical?
897 Views
1 Solution
Accepted Solutions
Champion III
2011-11-01
05:29 AM
- Mark as New
- Bookmark
- Subscribe
- Mute
- Subscribe to RSS Feed
- Permalink
- Report Inappropriate Content
Hi,
Set values on Data points and then in presentation tab select Vertical check mark -> Plot value inside segment
Rgds
Anand
569 Views
1 Reply
Champion III
2011-11-01
05:29 AM
- Mark as New
- Bookmark
- Subscribe
- Mute
- Subscribe to RSS Feed
- Permalink
- Report Inappropriate Content
Hi,
Set values on Data points and then in presentation tab select Vertical check mark -> Plot value inside segment
Rgds
Anand
570 Views